How to Time Market Bottoms, Part 2
Back in mid February
I wrote a trading lesson designed to teach you about
indicators that suggested the early signs for a possible intermediate term low
forming in NYSE and S&P 500 markets.
In this article, I will introduce you to the short-term analysis that I combine
with the longer-term indicators that I covered in my previous lesson.
For a quick review, we showed that the Bullish Percent Index (BPI), “Stocks
above 200 DMA falling below 20%” and Volume Trend Oscillator (VTO) are all
indicated bullish intermediate term signs. Let’s take each intermediate term
indicator and look where they stand now.
The Bullish Percent Index (BPI)
First let’s take a look at the Bullish Percent Index (BPI). The Bullish
Percentage Index (BPI) shows the percentage of point & figure chart buy signals
for all the stocks in a given index. This chart tells us if the index is
medium-term overbought or oversold based upon price.

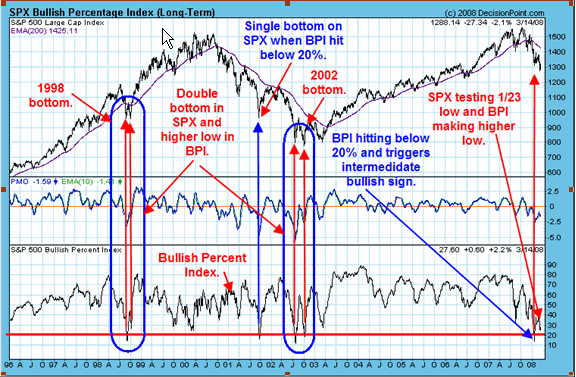
Above is the Bullish Percent Index (BPI) from the close of March 14, 2008. An
intermediate term low is signaled in the SPX when the BPI index falls below 20%.
We have labeled all instances of this occurrence dating back to 1996. We have
circled in Blue where the SPX made a double bottom and the BPI made a higher low
then the first low and where the first low traded below the bullish 20% level.
This bullish setup occurred in 1998 and 2002. A single low was made in the BPI
below 20% along with the SPX in October 2001 and that rally traveled over 20% in
about 3 months. It appears the current SPX market is making a double bottom
similar to the 1998 and 2002 lows. The above SPX chart is a line chart and does
now show the lowest low, only the closing low. The lowest low this year came on
1/23 at the 1270 range and the SPX is attempting a test of that low as of this
writing. Since the BPI index fell below 20% in late January, a bullish signal is
being triggered that is similar to the bullish signals triggered at the 1998 and
2002 double bottoms.
Percent of NYSE Stocks Above Their 200-Day Moving Average
The Next chart is the “Percent of NYSE stocks above their 200-day moving
average.” To help identify intermediate term lows we monitor the “NYSE stocks
above 200 day moving average” because this takes in the account of the
intermediate term timeframe and is the timeframe we are interested in at this
time.
When a stock is above a moving average then it’s considered bullish and vice
versa. However, when stocks fall to where only 20% of all stocks on the NYSE are
above their 200 day moving average then the market is considered oversold and
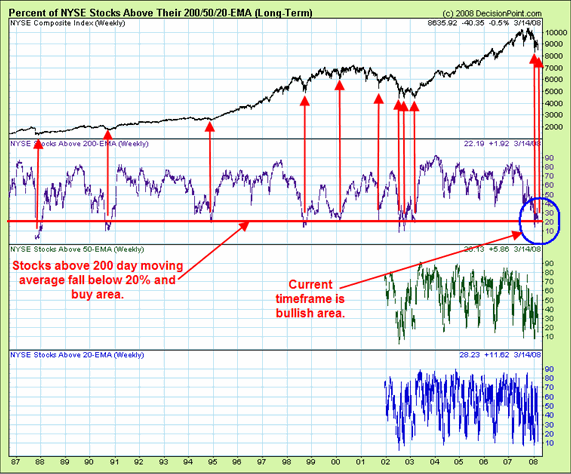
due for a rally. The chart below is the NYSE which dates back to 1987. The
second window down from the top is the “NYSE Stocks above 200 day moving
average” and the window we want to analyze because it’s the timeframe that we
want to monitor.
Notice that currently the “NYSE percent of stocks above 200 DMA” has fallen
below 20% and are considered oversold and are now bullish. Since 1987, stocks
above 200 DMA fell below 20% nine times (not counting current reading) and all
nine times the market rallied a decent percentage afterwards. Putting it another
way, if you have shorted the market when stocks above 200 DMA fell below 20% you
would have lost nine times in a roll. This chart is bullish.

The On-Balance Volume Indicator Set
The next chart is On-Balance Volume (OBV) Indicator Set. OBV, invented by Joe
Granville, is calculated by adding the daily volume to the cumulative total of
volume if the stock closes higher than the previous day, or subtracting it if
the stock closes lower. No-change days are ignored. Therefore OBV helps a trader
to identify the volume flows of an issue or index and determine if it’s bullish
or bearish. Traders can Google On Balance Volume for a more in-depth explanation.
The window of time we are interested in is the intermediate term and Volume
Trend Oscillator (VTO) takes account of this timeframe. VTO summarizes rising
and falling OBV trends. These charts tell us if the index is overbought or
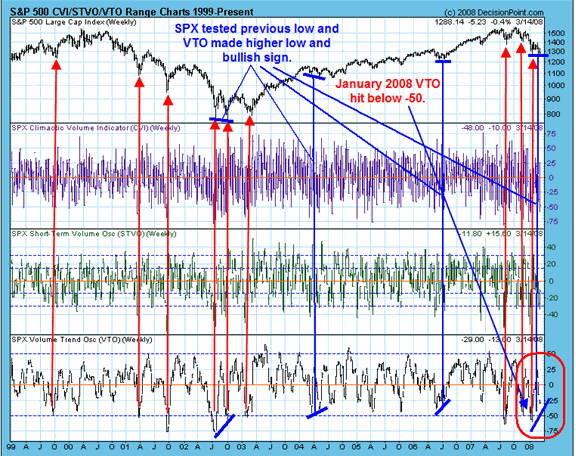
oversold based upon volume in the intermediate term time frame. The chart below
is the S&P 500 (SPX) dating back to 1999. The bottom window is the Volume Trend
Oscillator. When VTO reaches below -50 then the SPX is near an intermediate term
low.
VTO hit below -50 eight times (not counting the January reading below -50) going
back to 1999 and in all cases after, the market produced a worthwhile rally. We
also noticed that when SPX tested its previous low and VTO made a higher low
then its previous low a bullish divergence developed. We have pointed these
instances out on the chart below. Currently SPX is attempting to test its
January low and VTO is much higher then its previous low and is a bullish
divergence for the shorter term. Therefore, according to BPI, stocks above 200
DMA fell below 20% and VTO, the intermediate term picture is bullish. Now lets
move on to the shorter timeframe.

How I Perform Short-term Analysis of the Markets
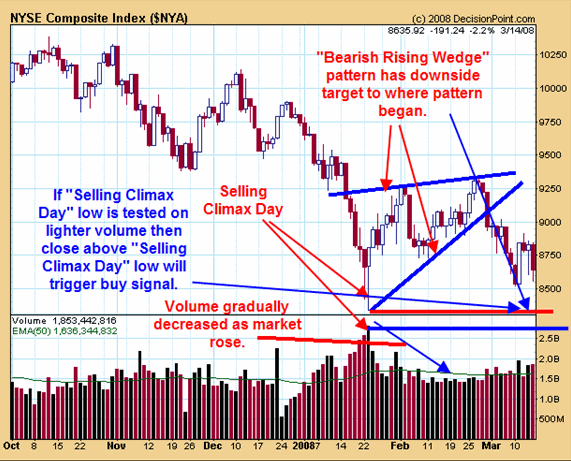
This is our view of what the short term holds. A “Selling Climax Day” appeared
on January 23. A “Selling Climax Day” is a high volume day that stops the
decline and reverses the market. A “Selling Climax Day” appeared on January 23.
Most, but not all “Selling Climax Days” are re-tested.
After the “Selling Climax Day” of 1/23 the market worked higher and formed a
“Bearish Rising Wedge.”
A “Bearish Rising Wedge” is where the market works higher and volume gradually
decreases. “Bearish Rising Wedges” have downside targets to where the pattern
began and in the current case this pattern has a downside target to the January
23 low.
Now let’s turn our attention back to the “Selling Climax Day” of January 23.
When a “Selling Climax Day” is tested on 10% or lighter volume and then closes
above the “Selling Climax Day” low, a bullish short term buy signal is
triggered.

Volume on the “Selling Climax Day” for the NYSE on January 23 came in at 2.8
billion shares. If the NYSE touches the January 23 low of 8343.42 or below and
volume drops to 2.52 billion shares or less and then closes above 8343.42, a
short term buy signal will be triggered.
The pattern on the NYSE would turn into a double bottom pattern which is a
stronger pattern then a single bottom pattern. This potential short term bullish
signal should produce a rally that could last into May. We do have some thoughts
on the upside and our minimum upside projection would be the previous February
high near the 9300 range. However, since our intermediate term indicators are on
bullish signals, we expect the market to go higher then the 9300 range.
Tim Ord is president, editor and publisher of “The Ord Oracle” established
in 1990. His newsletter is a Monday through Thursday email report that trades
the S&P, Nasdaq and gold issues. He is frequently listed in the top 10 market
timers in the country. If you purchase his book “The Secret Science of Price and
Volume” through
www.ord-oracle.com you will receive a copy signed by Tim.
