How to Trade Diamond Top Reversals
Every trader should know the basics of simple price patterns on their charts. These repeated arrangements of price bars are nothing more than the human emotions of fear and greed measured with real money at work in the markets.
The best part is, basic chart patterns have existed since charts were invented, probably drawn on pressed paper with quill pens. Price patterns repeat themselves in all markets with no exceptions. They are visible in all timeframe periods on charts, and they function exactly the same regardless of all else.
Diamond Breaks
One of the most predictable outcomes from price prediction is downside breaks out of a diamond pattern. This one is visually easy to spot: once you have your eyes trained to see the distinct formations, they leap out from the charts at first glance.
Figure 1: ES 1-Minute Chart
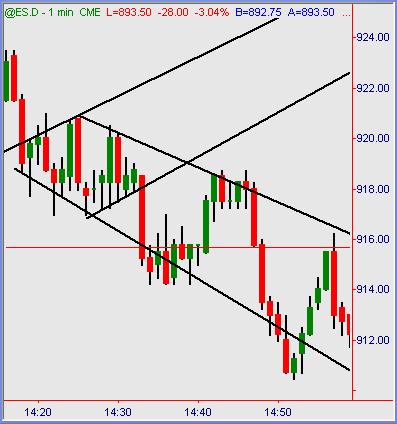
Basically it’s a series of higher-highs/lower-lows price bars followed by lower-high/higher low price bars. Price action was expanding in the first half of the formation. Buyers were pressing higher, sellers were pressing lower as the movement compressed. The halfway mark is usually defined by a relatively large range bar(candle) or two. Then we see price movement begin to settle down in consolidation of those whipsaws. Things get quiet. Price action wedges itself into a narrow apex before breaking out. In almost every instance (but not all) the looming breakout will be downside.
This example in the S&P 500 futures noted on a one-minute chart shows exactly that process unfold. The market broke from swing highs, wound into a classic diamond pattern and broke lower from there. A quick pop from the reaction lows (which is a smaller diamond in itself) lifted back up to the centerline of pattern apex, tested former support now turned resistance and promptly broke to newer lows from there.
Figure 2: NQ 1-Minute Chart
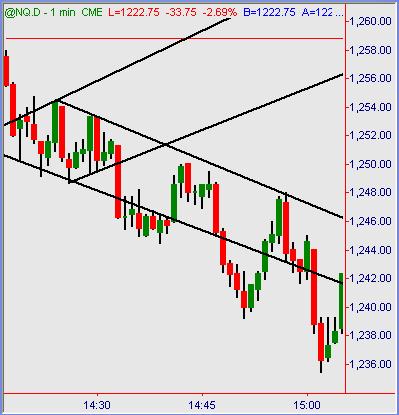
The fundamental principals behind diamond pattern formation is human-natured based. Therefore, it will hold true in all financial markets inside any time frame of chart. The Nasdaq-100 futures also staged a crystal-clear diamond pattern breakout in sequential fashion.
Figure 3: ES 1-Minute Chart
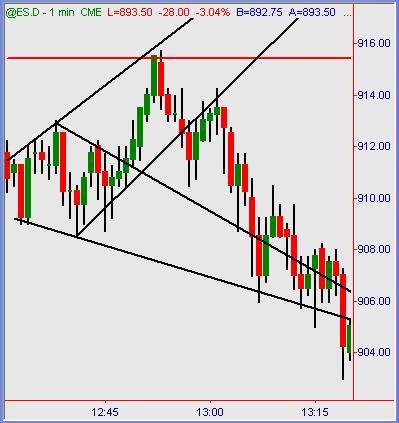
A characteristic of diamond pattern resolution is the false upside breakout. Sometimes they resolve with a sustained lift and rally. More often than that, rally attempts out of a diamond pattern are false breakouts that quickly fizzle and fail. Once price action breaks back through the pattern’s apex centerline of support, it’s usually bottoms out from there.
Figure 4: GBP/USD 5-Minute Chart
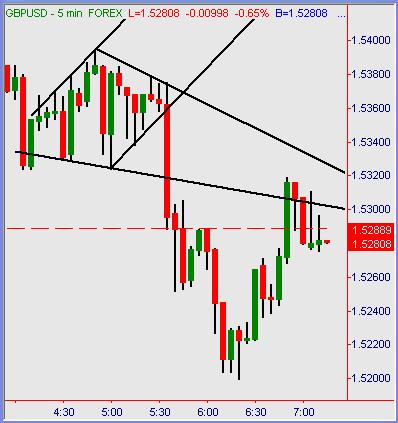
Like we said before… diamonds are a trader’s trusted friend in all markets on all time frame charts. The British Pound FX market also shows a crystal-clear pattern that resolved in high-odds frequency of prediction: lower from the break. Doesn’t matter what market, symbol or chart setting involved: diamond patterns appear regularly and predictably.
Summation
Simple price patterns have always worked in the past, they still work today and they will always behave the same forever. It is the pure measurement of market behavior going through its endless cycle of range expansion and contraction in visible form. Diamond patterns are one recurring form of consolidation – pause before price action continues on its chosen path. With a high degree of accuracy, diamonds break lower or at least predict lower price levels ahead once the right-side apex breaks. Learning to spot them on your chart is easy. The real-time formation of higher-highs/lower lows expansion followed by the complete reverse of that process in contraction is something to keep a trained eye on when they appear.
Austin Passamonte is a full-time professional trader who specializes in E-mini stock index futures and commodity markets. Mr. Passamonte’s trading approach uses proprietary chart patterns found on an intraday basis. Austin trades privately in the Finger Lakes region of New York. Click here to visit CoiledMarkets