How to Trade Forex with Precision
First of all, ponder this question for a moment:
What is the difference between technical analysis and trading strategy?
Unfortunately many traders do not recognize the difference. More than likely they are among the numerous technical traders out there struggling to find the perfect technical indicator or pattern that will work for them. They wonder why infamous indicators, written about in renowned books and courses do not help them profit, even when sure they understand it. They should stop looking. No single piece of technical analysis is enough for a trader to achieve consistency through trading. Consistent profitability comes from consistent application of a trading strategy. Firstly then, let’s clarify the difference…
What is technical analysis (TA)?
TA is the study of price action to forecast the probability of future price movements. When a certain TA tool triggers, there is more chance of the market going one way than the other. TA is grouped into many patterns and indicators with countless names. Common chart patterns include double tops, double bottoms, triangles (both ascending and symmetrical), flags, channels and of course the head & shoulders. Popular indicators among the hundreds of possibilities are the MACD, stochastic, RSI, volume, pivot points, Fibonacci & moving averages. The Japanese have given us names for many candle patterns consisting of hammers, shooting stars, doji’s and a hanging man to name but a few. All of the above named are considered forms of technical analysis. The truth is, these names are irrelevant and entirely unimportant. Taking a common form of technical analysis and applying a new name to it helps authors to sell many new books each year. Knowing the names of these patterns unfortunately does not help traders make money… yet making money is the end goal for traders right?
Profitability and consistency requires more than a name, it requires an understanding of the technicals followed by the skill and discipline to follow a proven & tested trading strategy through both good times and bad.
Click here to learn exactly how you can maximize your returns with our new 2-Period RSI Stock Strategy Guidebook. Included are dozens of high-performing, fully quantified stocks strategy variations based around the 2-period RSI.
What is good about TA?
Each technical aspect, when used and understood correctly, puts the odds slightly in your favor that price is more likely to move in the indicated direction, than the other. You have more chance of been right than wrong on a trade. This is assuming your use of the tool at hand and your entry point is close to perfect.
What is wrong with TA?
On its own, each TA tool puts the odds slightly in your favor and some TA is more powerful than others. Herein lies the problem. The odds of been correct are just slightly in your favor. ‘Slightly’ is not good enough. Not to mention that with a bad entry or a little bad money management, regardless of what the TA is telling you, your odds of winning have just completely reversed.
Many new traders begin by learning a variety of TA tools. This usually comes from a seminar, a book or a website. Excited, the trader thinks he understands head and shoulders patterns and has just unlocked the secret to infinite wealth. He starts trading the patterns but finds them a lot harder to interpret in real time then in hindsight. Where exactly should he enter & exit? Having lost money on these patterns he hears of another trader making money using the MACD indicator. With renewed excitement he studies the MACD and starts trading but still loses. The frustration is now building and confidence is low. John, a trader he met recently said he was making money trading gold. Perhaps that is the secret… so he switches from trading stocks to trade gold yet still loses. A lady he met was using expensive charting software while he is still using free stuff. He purchases the fancy software, is more money down for doing so and still consistently losing in his trading. What could possibly be wrong? Perhaps the timeframe… he has heard that short term traders make less than long term traders so he switches from minute charts to daily charts. Now the losses are larger and more drawn out over a longer period of time. He thinks he understands the technicals but they are quite simply not working out.
This is a common problem and many traders could recognize themselves or others who have experienced a very similar situation. I think that every technical trader has likely experienced it early in their career. As a mentor for traders just starting out, all the way through to full time professionals, I see this happening all the time – and trust me, I don’t just see it with the beginners! The solution lies not just in understanding these technicals, but by formulating TA into a precise trading strategy.
Technical Analysis vs Trading Strategy
Think of technical analysis as ingredients. Trading strategy is the recipe. Imagine you want to bake a chocolate cake and like me you have not done this before. You have sugar, flour, chocolate, butter and milk… but no recipe. What do you do? Where do you start? The ingredients are of no use to you on their own. The recipe is what enables you to get the end result – a chocolate cake.
Each technical tool can have many uses, just like a cup of flour can. Similarly, each is virtually useless on its own. Many traders are using each TA tool in isolation and moving from tool to tool trying to find the one that works. That is the equivalent of trying to bake a cake with a cup of sugar and when that fails, trying to bake it with a cup of flour. Just like a cook needs a recipe to achieve an end result, a trader needs a trading strategy. In this case the end result is a trade that has a higher probability of doing what you expected than not. Trading is a game of probabilities and a good trading strategy puts probability in your favour.
Technical Trading Strategy for Forex & Indices
Leading vs Lagging Indicators
Certain technical indicators are more powerful than others. For example the MACD cross over buy/sell signal or entering a trade when one moving average crosses through another are two of the worst possible reasons for entering a trade (IMHO). Unfortunately, they are also two of the most common entries that struggling traders look for. One reason they are ineffective is that they are lagging indictors – that is, they only highlight ideal entry points in hindsight once the price has already moved beyond that point. It is essential to use leading indicators. A leading indicator shows that the price is more likely to move one way than another before it happens.
Two of the most powerful leading indicators at a trader’s disposal are divergence and pivot points.
Technicals (Ingredients) for the ‘Precision Scalp’ Trade
To execute the Precision Scalp correctly you must use both:
- Divergence (between price and indicators) and;
- Pivot Points
Information on these technical tools is widely available and the intention of this article is to teach you a trading strategy, not to regurgitate the same technicals taught by many. If you are unfamiliar with these technical tools then please email me for further reading recommendations.
Precision Scalp Trade on Spot GBP/JPY
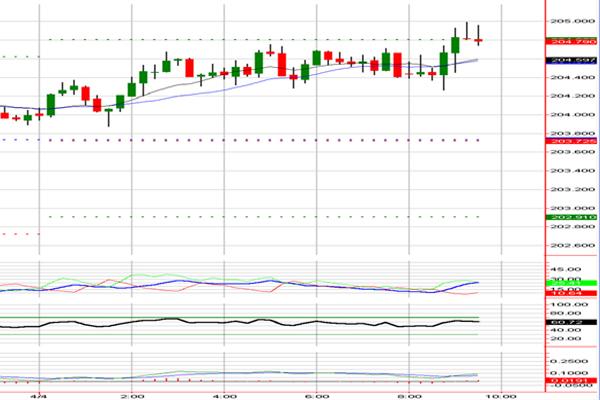
Image One shows a 15 minute currency chart for sterling vs the Japanese yen. Note price is touching a pivot point and as price breaks up to new highs, both the MACD & RSI fail to do so resulting in bearish divergence. The criteria to place a Precision Scalp short trade right now is met. Between the four timeframes on Image one and two, there are multiple reason to say that they price is about to fall.
- Bearish Divergence on 15m RSI
- Bearish Divergence on 15m MACD
- Bearish candle pattern formed on 15m chart
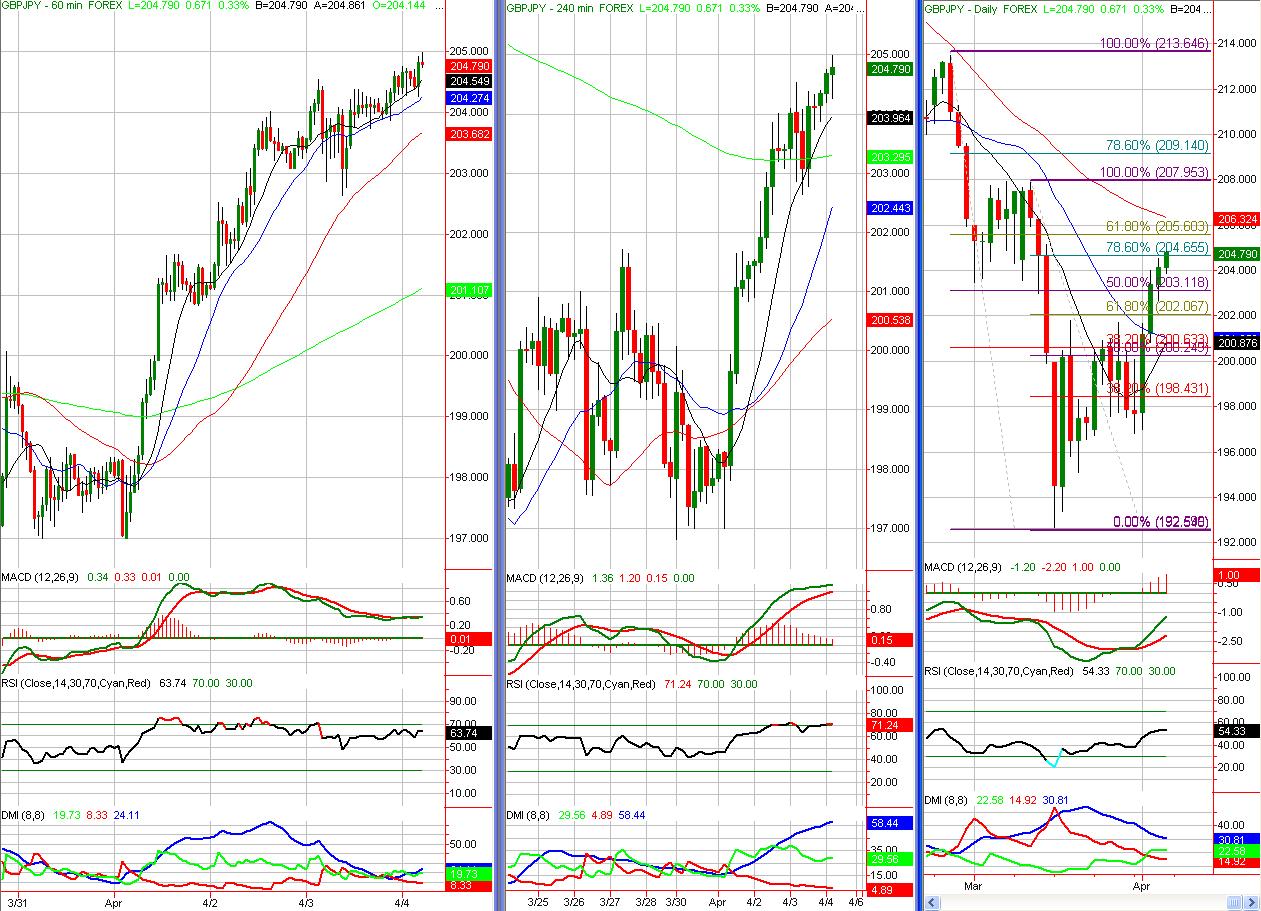
- Bearish divergence is even more apparent on the one hour chart (Image Two), again on both the MACD & RSI
- Fibonacci – In addition to all of this, a huge bonus is that the daily chart has rallied into a cluster of Fibonacci levels (Image Two). This is a sell area and the lower timeframe is simply providing the ideal entry point.
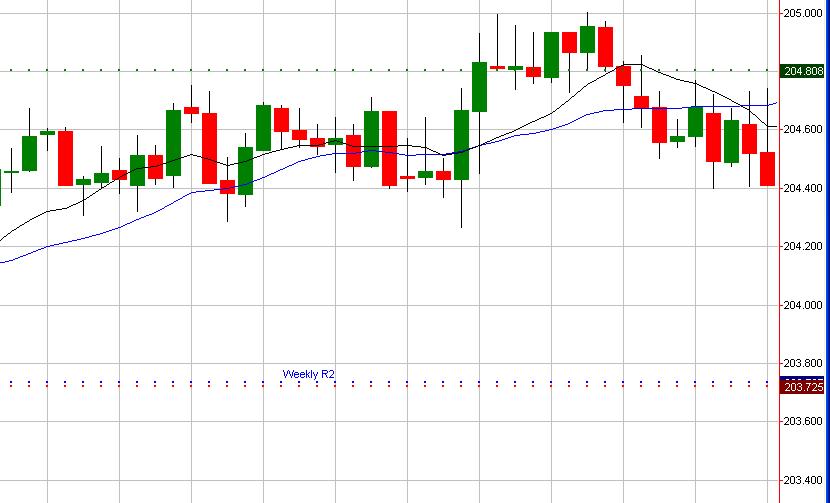
There are multiple reasons to short GBP/JPY right now for a high probability trade. You will never know whether any particular trade will be a winner or a loser. Rather, you will understand that a trade has more chance of working out than not and when executed correctly, a good trading strategy will make you more over the long run than you lose. This particular trade has some support at 204.40 which becomes an ideal target. Image Three shows the price having reached this target for a profitable trade.
Image One – 15 minute GBP/JPY Precision Scalp trade short entry
Image Two – GBP/JPY 60 Minute chart (left) shows significant divergence on MACD & RSI. Daily chart (right) pulled back into a cluster of Fibonacci levels.
Image Three – Precision Scalp winner on GBP/JPY, target hit.
Precision Scalp Trade on Mini Dow Future – YM
Execution for the Precision Scalp can be in any time frame you prefer however the best short term scalp trades on index futures will set up on 1 & 2 minute charts. On currencies I prefer to use 15 and 60 minute charts. Of course the more timeframes you use for further confirmation, the better.
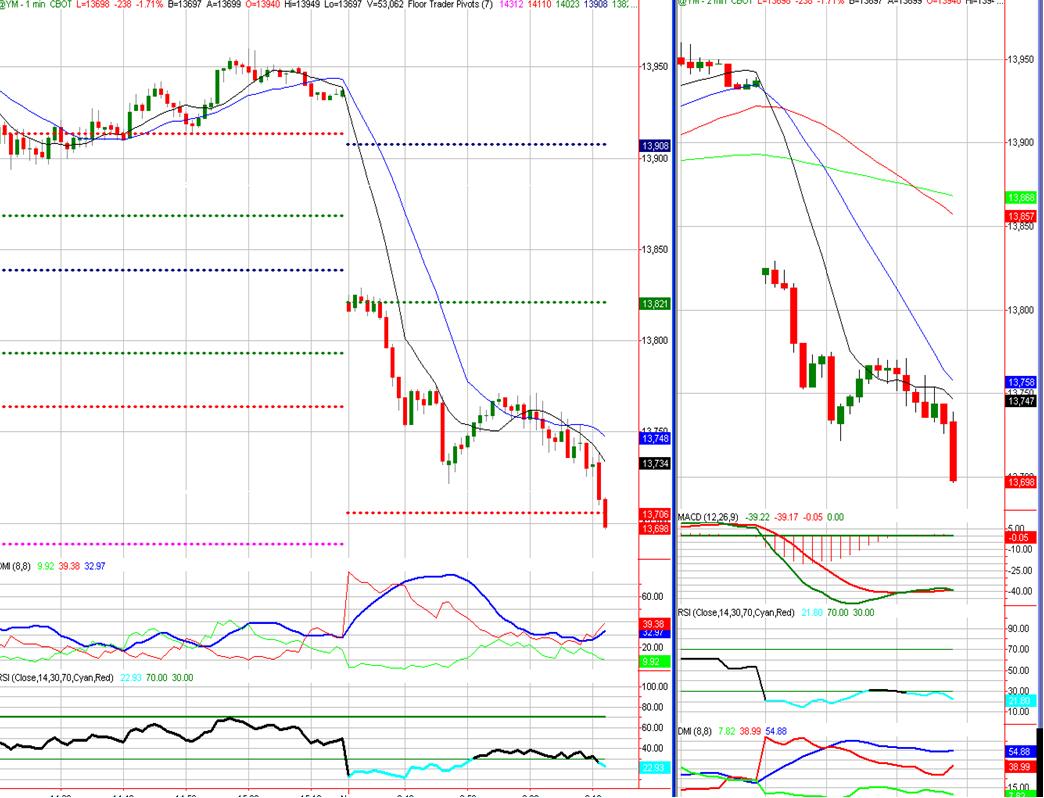
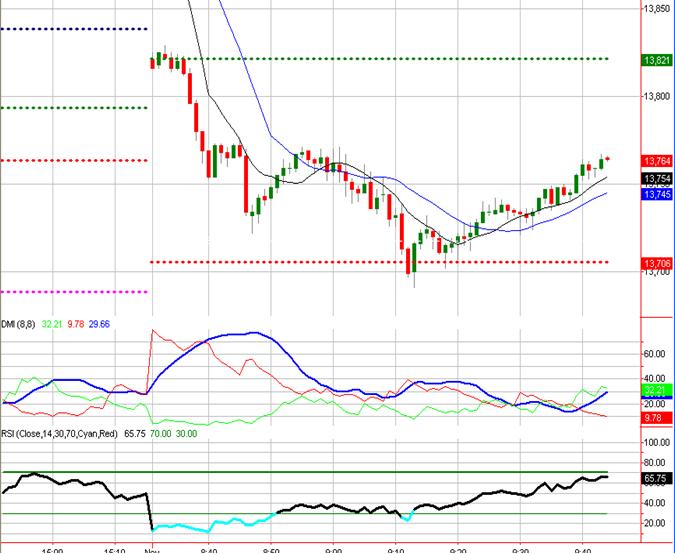
Image Four shows a Precision Scalp trade setting up live on the YM and is currently at the precise buy entry point. Our two main criteria for a Precision Scalp trade are met:
- The price is touching a pivot point
- There is bullish divergence
These two reasons occurring in unison formulates the Precision Scalp strategy and is enough reason for us to place the trade. For those with a full understanding of the technicals, you may also notice many reasons to think that this trade has more chance of rising from here than falling further, other than the two essentials listed above:
- Price touching daily S2 pivot
- Bullish divergence on 1 minute RSI
- Bullish divergence on 2 minute RSI
- Bullish divergence on 2 minute MACD
- Tick at extreme oversold levels (Image two, middle left)
- An unclosed gap on the 1m chart which has a high chance of closing, the trade is in the direction of this gap.
Image Five shows the result achieved when the long trade was executed – a good winner with still a lot of potential to move higher and scale out of the position if the gap closes.
Image Four – 1 Minute chart live entry with price touching daily pivot point plus bullish divergence on three indicators across two timeframes (1m middle, 2m right).
Image Five – Winning Precision Scalp trade on Mini Dow
The Possibilities are Endless
There are thousands of possible technical combinations for the charts to set up for a high probability entry point. The best trading strategies that you could ever create surrounding these possibilities are ones that you create yourself. Aim to understand the markets, the technical aspects and the likely direction. Forget trying to memorize the names of hundreds of chart and candle patterns, it is completely unnecessary. Imagine if you had to learn the names of all the parts under the hood of your car before being allowed to drive it. It would take a lot longer to get your driving license; some would perhaps never get it!
Once you have found the technicals that you like and understand the most, you should look for combinations of these tools all setting up at the same time. I.e. you have many reasons at a precise moment in time to believe that a price chart is more likely to move one way than another. This is a trading strategy and is essential to set you on the path to trading success. Money and risk management are also crucial components of any trading plan, a good trader risks no more than 1% of capital on any one trade.
Thereafter, you must develop the trader mindset and the skills and discipline to stick to your strategies through all the ups and downs that the market will throw at you. No one said trading was going to be easy but the good news is that it is very possible for those with drive, passion and patience. Happy trading and as my trading psychology coach Steve Ward always tells me – Get rich slowly!
Nick McDonald is a specialist in the Index and Currency markets. An advocate of leading market indicators, he compiles layers of multiple reasons for entry which form the basis of his strategies. Nick is a highly respected trading mentor and founded Trade with Precision to teach aspiring traders his unique approach to trading with charts. Complimentary educational seminars and more information are regularly available at www.tradewithprecision.com.

