How to Use Options to Generate An Income Stream
What is an iron condor?
The advantages of an iron condor spread are well known, and attractive to most options traders: iron condors allow you to profit from the fact that an option is a decaying asset, meaning that it is the passage of time that generates profits for a trade of this type. Additionally, an iron condor can be constructed as a market-neutral position, such that you don’t necessarily need to worry about picking a direction in which you think the underlying equity or index will move.
Click here to order your copy of The VXX Trend Following Strategy today and be one of the very first traders to utilize these unique strategies. This guidebook will make you a better, more powerful trader.
If you’ve never heard of an iron condor before, the trade itself looks complex but is actually fairly simple. It is composed of four parts or “legs”, each of which is intended to lose value over the life of the trade, such that all four legs can be exited at or near expiration for little or no cost. The four legs of an iron condor are: one long put, one short put, one short call, and one long call, all with the same expiration date and on the same underlying entity. The long put should be just as far away from the short put as the long call is from the short call. This ensures an even distribution of risk, and allows options-friendly brokers to only require margin for one side of the position.
Let’s look at an example.

With SPY at $133.75 about 6 weeks prior to the expiration month we’re trading, and implied volatility in that month’s at-the-money options at 27%, an example of an iron condor would be:
+1 SPY 145 call -1 SPY 143 call -1 SPY 125 put +1 SPY 123 put
Given the above parameters, a trade like this would generate roughly INITIAL_CONTENT.74 credit per contract. That means that for a one contract position, you would receive $74, and would keep all of that premium if the trade expires worthless.
One of the key factors determining whether an iron condor will be successful or not is the selection of strike prices for the position. This aspect of the strategy is probably the one that new traders have the most trouble with: looking at a big board of strike prices, how do we know which ones to choose? If we enter a trade that is too narrow (i.e. one where the short call and short put are not very far apart), we will take in a large premium, but the odds will be very low of that trade succeeding. Conversely, if we enter a trade that is too wide (that is, if the short call and short put are extremely far apart), then while the trade may be very likely to succeed, the miniscule amount of premium received may not justify the risk involved. So it seems we need to find a reasonable balance between the amount of premium we want to collect and the probability of success for the trade.
Subjective selection of strikes based on “feelings” or “hunches” obviously won’t get us very far. Some traders try to use technical analysis to help with strike selection, but that can only give us part of the picture, and risks bringing directional bias into our trades. Note that there’s nothing wrong with a directionally biased iron condor, if that’s what you intend to use – but if we want to create a truly market-neutral position, a more statistically oriented methodology may be in order.
The One Sigma Method
Perhaps the simplest way to construct an iron condor with a reasonable chance of success – while still generating sufficient premium – is to select short strikes that are one standard deviation from the current price of the underlying. The reason we use this metric is that, about 68% of the time, the underlying index or equity we’re using will close on expiration day within one standard deviation (or “one sigma”) of the current price. So if we structure our trades so that they can tolerate a one sigma move and still expire worthless, then we can expect success over two thirds of the time.
A standard deviation is a measure of the distribution of a given set of values. In trading, we usually assume that values will be normally distributed, and therefore that any given possible value will fall within one standard deviation of the mean about 68% of the time. Two standard deviations from the mean account for almost 95% of all possible values, and three standard deviations account for nearly 99%. Now, if we think of short iron condors as insurance policies – in other words, imagine that we’re collecting premium for insuring someone else against an extremely dramatic move in prices – no one is going to pay us very much premium for insuring against an event that only happens 1% of the time. So going out three standard deviations will never yield very much premium, and the same holds for two standard deviations.
However, at one sigma, things start looking much better. So we need to figure out how far to place our short strikes in order to capture that first standard deviation. There are three crucial variables to consider here: price, time, and volatility. Specifically, we need to know: 1) the current price of the underlying, 2) the volatility that has been priced into the options we’re going to trade, and 3) how much time to include in our considerations. The current underlying price tells us where the mean of our distribution curve will be, while the amount of volatility priced into the options tells us how wide the distribution is likely to be. The time left in our options tells us how far out to look in determining the possible range of values.
So we can use a fairly rudimentary formula for figuring out one standard deviation. Note that this is almost a “back of the napkin” sort of formula, and it certainly won’t get us published in any academic finance journals, but it works well enough for our purposes:
1sd = underlying price X volatility X sq (days to expiration/365)
So, one standard deviation (sd) equals the current underlying price times the current implied volatility of the options we’re trading, times the square root (sr) of the days until those options expire divided by 365. This may sound complicated, but let’s work through an example and you’ll see that it’s actually simple enough.
Constructing the Trade
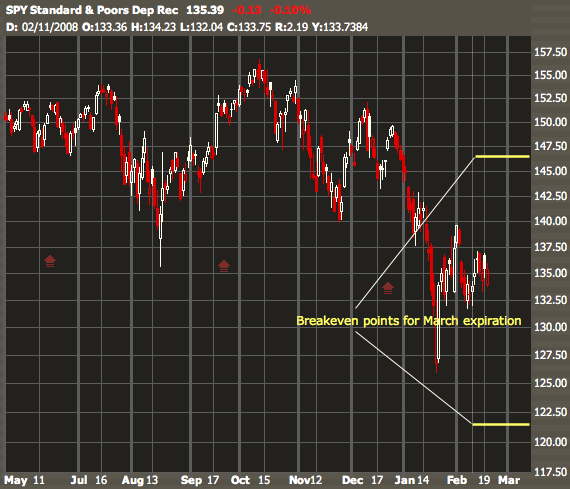
We’ll use the same data as in our first example. SPY, the ETF that tracks the S&P 500, is at $133.75, and we have 39 days until the expiration of the options we’re going to trade. Additionally, the volatility on those options is at 27.5%. So we have all the data we need to find one standard deviation:
1sd = 133.75 X 27.5% X sr (39/365)
which is
1sd = 133.75 X 0.275 X 0.3269
or 12.02. So to find our short strikes, we need to add 12 points onto the current price, which means the first part of our trade will be:
-1 SPY 146 call -1 SPY 122 put
Since SPY options have strikes that are dollar-denominated, we’re rounding to the closest strike price. Thus far, all we have is a short strangle, which in addition to exposing us to unlimited risk, uses up dramatically more margin. So we hedge those short options with some long options just a couple strikes out:
+1 SPY 148 call -1 SPY 146 call -1 SPY 122 put +1 SPY 120 put
A trade like this might generate about a INITIAL_CONTENT.45 credit, or $45 per contract. While that’s a bit less than the $74 we pulled in from our earlier example, this latter trade has far better odds of expiring worthless, allowing us to exit the position at minimal or no cost.
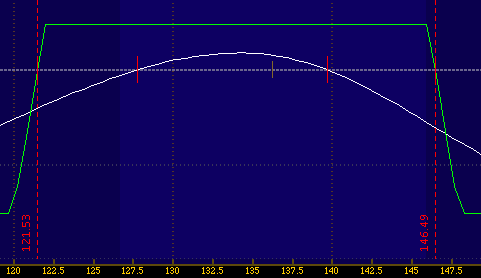
Consider this risk analysis graph.

The green line represents the profit/loss outcome of our trade at expiration, depending on where the underlying SPY ends up. The white line represents the current value of the trade based on the position of the underlying. Notice that – as the dotted line on the left side portrays – if SPY closes at expiration above 121.53, our position will make money. Likewise, if SPY closes below 146.49, we’ll make money. The green profit/loss line drops off rapidly outside of that range, such that we hit our maximum loss if SPY closes at 120 or below (our long put strike) or at 148 or above (our long call strike).
One other matter: getting a volatility figure for the options you’re trading is the only non-obvious data point in this formula. Your broker may be able to provide this information, or you can get current data from sites like iVolatility.com. One other idea: you can use the volatility indexes that are freely available if you’re trading the major index products (for SPX/SPY, use the VIX; for NDX/QQQQ, use VXN, for RUT/IWM, use RVX; for DJX/DIA, use VXD). Now, these different data sources will likely give you slightly different numbers, but that’s okay – the point is just to get a reasonable approximation.
Pulling Some Extra Premium
We thought we’d wrap things up with a suggestion on squeezing some extra premium out of your trades without altering anything in the process described above. It’s deceptively simple in theory, but many traders have a tough time applying it in practice.
The suggestion is simply that you open iron condors when volatility is particularly high, and that you round down (i.e., towards the underlying) instead of rounding up when you’re selecting your short strikes. If volatility spikes up dramatically above its recent levels (as often happens during days with intense selling), that’s often an excellent time to open a new condor position: when volatility falls back off, you’ll be left with a trade that is still one sigma wide – or close enough – but has generated even more premium up front than you otherwise would have received.
Jonah Williams is a trader with Condor Options (www.condoroptions.com), an options trading newsletter and blog that focuses, as you might expect, on iron condors and volatility trading. He can be reached at jonah@condoroptions.com.
