How to Use PowerRatings Heat Maps
TradingMarkets is
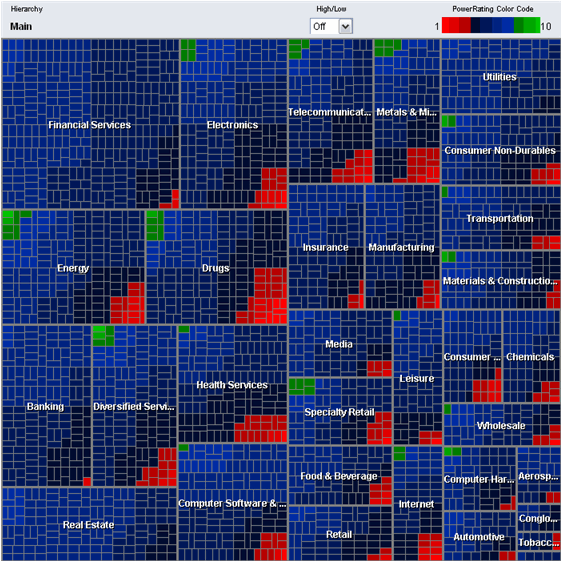
proud to present our newest tool- The PowerRatings Heat Map, which gives you
instant insight into the market. Over 3,000 stocks are broken down into
their sectors, and then sorted according to their
PowerRatings.Â
Stocks with high PowerRatings (strength) are colored green, and stocks with low
PowerRatings (weakness) are colored red. Neutral stocks are blue. By comparing
the number of reds to greens, any trader is given a visual breakdown of each
sector and how individual stocks are performing in those sectors.Â
The
PowerRatings Heat Maps can be used a number of different ways:
1.
Determine short-term overall market strength.
The PowerRatings
Heat Map can instantly reveal to a trader where market strength and weakness
lies, using PowerRatings as its primary function. PowerRatings are a quantified
rating method that determines the probability of a stock’s movement over the
next five days. By just looking at the Heat Map and comparing the number of red
squares to green ones, traders can get an instant visual projection of the
short-term probabilities of market direction, based on individual stocks’
PowerRatings.Â

2.
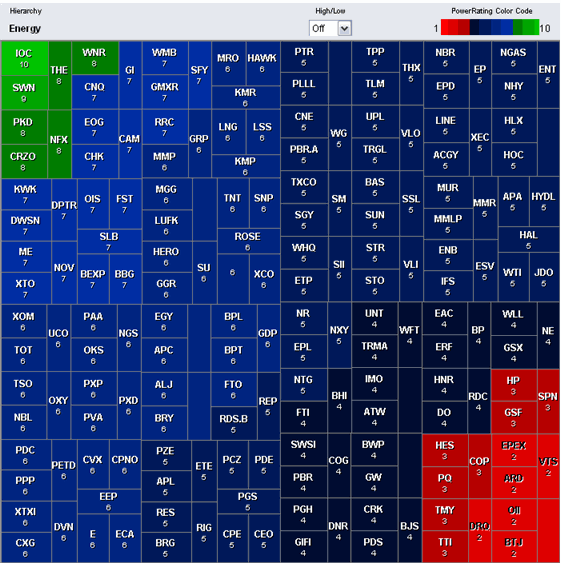
Single out strong sectors.Â
A
sector weighted with many greens and few reds is showing short-term strength,
and a trader is then able to single out specific stocks in that sector using the
color scheme. The great thing about the Heat Map is how quickly and easily it
allows the trader to focus; it only takes a look to determine which sectors have
the highest probability of making a move in the next few days. By sorting
stocks by sector and color, the Heat Map gives traders a great PowerRatings tool
to become more efficient at determining individual sector strength.

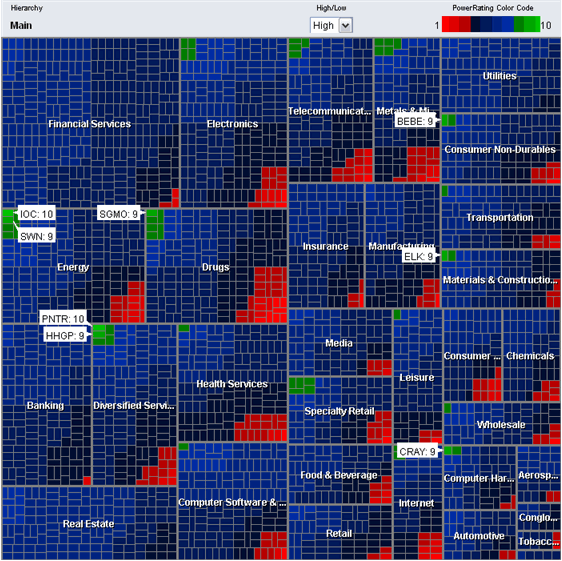
3. Find today’s highest PowerRatings
stocks.Â
Instantly access all the stocks with PowerRatings
of 9 and 10. Stocks with high PowerRatings have historically shown the greatest
out-performance versus the S&P 500.

As you can see from the images above, PowerRatings Heat Maps
present a powerful, yet easy to use, way of analyzing the stock market from
either a top-down or bottom-up approach. They allow you to visually inspect the
entire market of PowerRatings stocks in order to find the best trading
opportunities.
Gaining an edge in the markets used to take hours of daily research.
PowerRatings Heat Maps are about to change that.
Click here for your free trial.
Attend a free class on how to use
PowerRatings, presented by Steve Primo, our Director of Education.
Darren Wong
Associate Editor
Would you like to receive PowerRatings for full month for free? Send us your
PowerRatings strategy and if we accept it for publication, you will receive one
free month of unlimited access to PowerRatings. If you are already a monthly or
annual PowerRatings subscriber, you will receive an additional three months if
we publish your strategy.
Reminder: We are in no way recommending the purchase or short sale of these
stocks. This article is intended for education purposes only. Trading should be based on your own understanding of market conditions,
price patterns and risk; our information is designed to contribute to your
understanding.
Â
