How to Use the VIX to Guide Your Trading Decisions
What does volatility mean to us as options traders? Plenty, since it measures risk and investor sentiment.
As options traders, we are concern with two types of volatility — historical volatility and implied volatility. If you look at negative events in stock market history — the tech bubble bursting, Black Friday, the market meltdown in May 2006, and of course, our most recent meltdown in 2008 — you’ll see volatility in the markets at all-time highs.
Click here to order your copy of The VXX Trend Following Strategy today and be one of the very first traders to utilize these unique strategies. This guidebook will make you a better, more powerful trader.
You may know that the Chicago Board Options Exchange’s Volatility Index (VIX) measures volatility in S&P 500 stocks, and that its Nasdaq Volatility Index (VXN) measures volatility in the Nasdaq-100 stocks. But when it comes to individual stocks, you can make volatility your friend so that you can determine the best times to trade those names, and, conversely, when to stay far away from them.
First let’s take a look at a chart of the VIX and the S&P 500, as they provide us with a clear example of the wild ride in historical volatility and the concomitant decline in the S&P 500 during the most volatile periods.
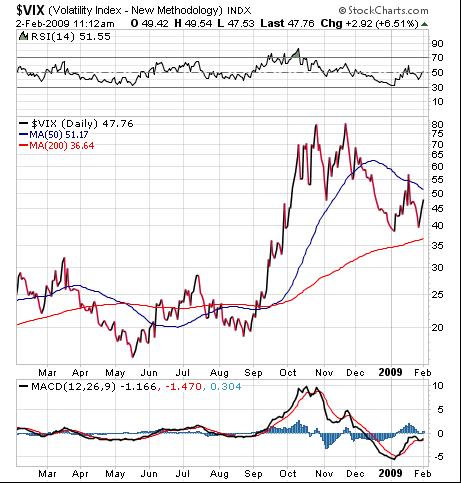
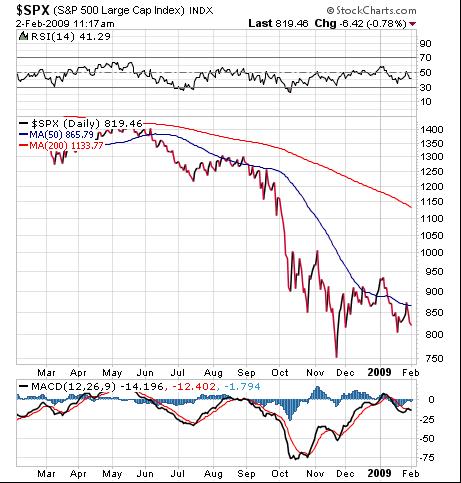
As you can see, the volatility (i.e., the immense level of fear in the markets) coincided with the huge drop in the S&P 500. In fact, the November high on the VIX nearly exactly marked the November low in the S&P 500.
Recently, however, the VIX has been a bit perplexing. The volatility measure has pulled back sharply and is way below its November highs. Why?
Perhaps the key to understanding the VIX and its actions right now is to take a trip down memory lane.
History Lessons
The VIX actually underwent a triple-bottom-making process during the last bear market, and it seems to be doing so now.
One reason for the declining VIX number is not so much one of lower fear but of an increase in capitulation. Traditionally, capitulation is the final emotional phase of a bear market, so one way to look at the VIX is that it may be calling a bottom here.
As you can see, historical volatility is useful to know when dealing with the markets, but it’s also important when analyzing companies in cyclical industries.
For example, the retail sector typically experiences a slowdown after the holiday shopping season. It can also pertain to a stock trading up or down when an earnings announcement, new product or FDA approval is due. By watching individual stocks over time, you can start to get a feel for a particular stock’s trading rhythm and play its options accordingly.
Now let’s turn to implied volatility, which is trickier to both predict and take advantage of when trading. Basically, implied volatility increases when the market is bearish and decreases when the market is bullish. This is due to the common belief that bearish markets are more risky than bullish markets.
For example, when there’s talk about a housing sector bubble (as we saw early in 2008), it can spur traders to make bearish bets with the purchasing of put options. Because puts are just a low-risk way of establishing short positions in stocks and/or sector indexes that might be affected by a sector slowdown (i.e., mortgage bankers, homebuilders, household-appliance makers), the negative sentiment for a sector ramps up the implied volatility of the put options.
Show Some Favoritism
As a trader, one of the best strategies you can adopt is to develop a cadre of favorite names that you can follow throughout the year that move higher or lower based on the fluctuation in implied volatility.
This tracking of certain stocks can be a bit time consuming at first, but once you can ascertain a stock’s trading “groove” — i.e., the company consistently comes out with well-timed product releases or fantastic Super Bowl ads that spur buzz and, in turn, sales — you can time your options purchases accordingly.
The bottom line here is that both historical and implied volatility are important factors to consider whenever you make an options play. So, if you want to make friends with the market’s wild side, then embrace the volatility.
Ken Trester started trading options when the first exchanges opened in 1973. He has been a computer science professor at Golden West College in Huntington Beach, CA, where he also taught a course on stock options trading. Ken is also widely quoted in publications such as Technical Analysis of Stocks & Commodities and Barron’s.