I expect energy to bounce back, here’s why
What’s Next? If Anything….
The market had another rough weak with the S&P
500 down roughly .78%. The breadth of the overall market did not improve and
actually worsened as well. The trade that I recommended for aggressive traders
in the iShares Dow Jones US Energy Sector
(
IYE |
Quote |
Chart |
News |
PowerRating) was stopped out. However,
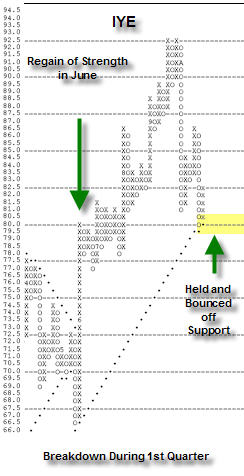
IYE has held at its support line that was established in June of 2005, when we
had a short-lived breakdown in the price of crude. Movement in the underlying
commodity has generally coincided with movement in the price of energy stocks.
Like now, the relative strength of the energy sector held up during the decline
in the first quarter of ’05. As happened in the first part of the year, I expect
that energy prices will bounce back unless we start to see a real deterioration
in the sector’s relative properties.
What follows is a chart of the relative strength
of the Morgan Stanley US Investable Market Energy Index
(
MSCIEN |
Quote |
Chart |
News |
PowerRating) versus
the S&P 500 Equal Weighted Index (SPWY). I prefer to use the equal weighted
index as it is more representative of how most portfolios are invested. (ie.
Most individual investors don’t buy more of a stock if it has a bigger market
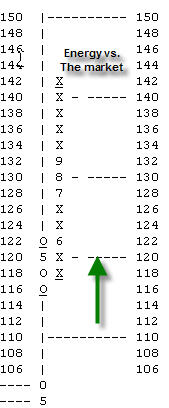
capitalization) As you can see, the chart remains firmly in a column of Xs,
meaning that the index continues to outperform the market on a relative basis
and is expected to do so. In general, investors should hold their positions in
energy related stocks. In order to increase exposure to the sector (if need be),
traders (and investors alike) could take another stab at the IYE on a new buy
signal at $87.00.
Another reason why I suspect that oil may stay strong is that we have yet to see
any real leadership from any other sector (s). Let’s look at two sectors that
would be considered defensive by some purely fundamental analysts: consumer
staples and healthcare. To do this I am going to look at the Morgan Stanley US
Investable Market Consumer Staples Index
(
MSCICS |
Quote |
Chart |
News |
PowerRating) and the Morgan Stanley
US Investable Market Health Care Index
(
MSCIHC |
Quote |
Chart |
News |
PowerRating) and compare them to the
S&P 500 Index Equal Weighted Index on a relative basis. In order to
compare apples to apples, I am going to stick with the Morgan Stanley Indexes in
my analysis because of their similar construction. I have no opinion as to
whether or not these indexes are superior to any other. What follows is the
relative strength point and figure chart of MSCICS vs. SPWY for 2005:
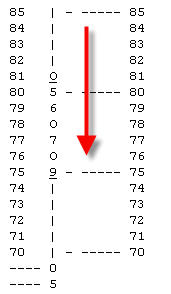
As you can see, the chart is in Os (or in a negative trend for those of you
unfamiliar with point and figure) and has yet to make any attempt at a reversal.
In fact, the chart actually worsened in September after flat lining in July. The
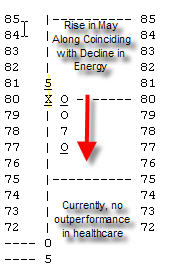
next chart is MSCIHC vs. SPWY. It, too, is in a column of Os after a brief
bounce to Xs in May-which was right about the same time as the ending of the
first decline in energy prices, and the market (see the chart of IYE above for a
clearer picture). We have yet to see another reversal to Xs during this current
decline in the market.
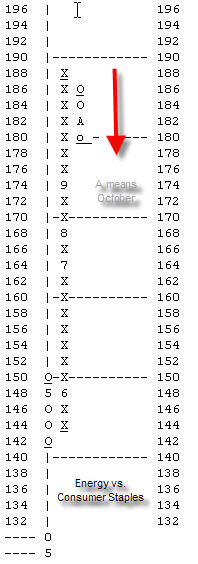
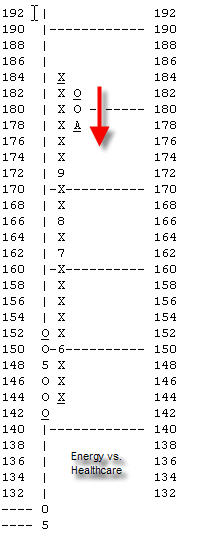
The next two charts compare the Morgan Stanley Energy Index versus the Morgan
Stanley Consumer Staples Index and the Morgan Stanley Healthcare Index. As you
can see, energy has weakened in its’ relative performance versus these two more
defensive type sectors, after a stellar outperformance. Energy has not gotten
through the last two weeks unblemished. However, neither of the two defensive
sectors that we have looked at has been able to strengthen. It is more of a
condition of the weakening of energy rather than the strengthening of the other
two sectors. I will continue to watch these charts in order to tell where we
could get some growth. If either the consumer staples or healthcare indexes
reverse to Xs on there relative strength charts versus the S&P 500 Equal
Weighted Index, then they could be areas of leadership. It could also be a clue
as to where the economy may be heading.
Â
Sara Conway is a
registered representative at a well-known national firm. Her duties
involve managing money for affluent individuals on a discretionary basis.
Currently, she manages about $150 million using various tools of technical
analysis. Mrs. Conway is pursuing her Chartered Market Technician (CMT)
designation and is in the final leg of that pursuit. She uses the Point and
Figure Method as the basis for most of her investment and trading decisions, and
invests based on mostly intermediate and long-term trends. Mrs. Conway
graduated magna cum laude from East Carolina University with a BSBA in finance.
