I Find This Disturbing
The major indexes started the New Year in a negative
fashion, and there wasn’t any specific news to account for the weak
behavior in what has historically been a very strong seasonal period. While
there were some negative economic and company-specific reports, the overall news
flow appeared mixed at worst. It just seems that the long side of the market
simply became too crowded, as those who wanted to buy stocks likely had already
done so and decided to bank some deferred profits. Higher beta small-cap names
were the largest losers for the week, while Energy shares were one of the few
pockets of strength. It’s also worth noting that the price of gold dropped $19
in the last 5 days of the year, largely due to a very sharp rally in the U.S.
Dollar.
The March
SP 500 futures closed out the week with a loss of —27.50 points, while the Dow
futures tumbled – 169 points. On a weekly basis, the ES posted a market
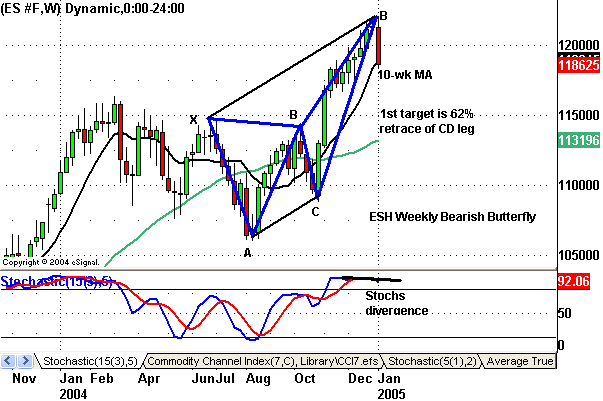
structure high and broke its Butterfly pattern with divergence, giving a 1st
target of 1139, but found some support at its 10-week MA. Looking at the daily
chart, the contract is forming a bear flag as it remains wedged between its
50-day MA support and 34-day MA resistance. The YM also found support at its
10-week MA and settled right at the week’s low. For you daily 3-Line Break
followers, the YM and ES remain short with Break Prices of 10832 and 1215.50
respectively. In the small caps, the ER2 confirmed its weekly Butterfly
pattern, giving a 1st target of 600.
               
The U.S. Dollar posted a weekly
market structure low and settled above its 10-week MA for the first time since
September. The 10-yr Note (ZN) made a new weekly high AND low after the
Employment numbers and continues to form a symmetrical triangle. The
Semiconductor Index (SOX) posted a weekly market structure high and finally
broke its long bear flag.
Markets
often act in a way that confounds the majority, and that’s exactly what
transpired in the first 5 days of 2005. Just last week, the Investor’s
Intelligence Sentiment data recorded its highest bullish reading since prior to
the crash of 1987. And this survey wasn’t alone, as the P/C Ratio, VIX and
several other sentiment surveys suggested that market players had become too
complacent. And so, a much-needed correction took place. This correction could
actually be very healthy in the longer term, as many of the weak holders are
shaken out of their positions. According to the historical record since 1950, a
down close during the first week of January by the SP 500 has resulted in a down
year 45% of the time. A loss for the entire month of January raises the
percentages for a down year to 58%. The good news is the SP 500 is still sitting
above its 50-day moving average. The bad news is that the NASDAQ and the Russell
2000 closed beneath that support line. Those were the 2 groups that led the
market higher during the second half of 2004, and are now leading it lower. If
there was anything disturbing to me, it was the fact that mutual funds
experienced a large outflow in the last 2 days of 2004 and first 3 sessions of
2005 (per AMG). Outflows are very unusual for this time of year, and inflows
are often what are cited for the reason stocks historically perform well in this
time of the year.Â
               
Â
Please feel free to email me with any questions
you might have, and have a great trading week!
Chris Curran
