I See These Two Nice Patterns In GPRO
The
light volume pullback that the market experienced
leading up to today acted very well. Today we saw the uptrend begin to
reassert itself. The higher volume today was also encouraging. The
highs of last week are just above current levels, so it will be key to see if
the market can break though them decisively. As of right now, the long
side still looks like the place to be.
Coming
into today, there were some good reasons to believe that the uptrend would reassert
itself. The price and volume action of the indices looked great on the
pullback. The action in the VIX yesterday led to CVR I and CVR II signals
both triggering last night. Lastly, when looking through my charts last
night, I saw a LOT of stocks that had put in some nice tails lower yesterday.
If the market were to reverse, I felt many of these stocks could offer some
good opportunities.
Gen-Probe
Inc.
(
GPRO |
Quote |
Chart |
News |
PowerRating)
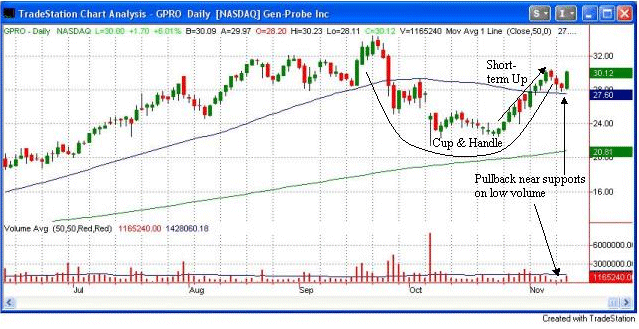
was one such stock that caught my eye. After being a market leader from
March through September, GPRO faltered and began to form the base it currently
resides in. After forming a potential bottom during the middle of October,
GPRO started to climb again. From 10/23 to 11/07 GPRO managed to make
higher highs every day — 11 days in a row. When the market began pulling
back a few days ago, so did GPRO. The pullback stalled and reversed yesterday
just above the 50day moving average and the .38 Fib retracement of the 10/23
thru 11/07 move.

When looking
at the chart I saw two nice patterns forming. 1) A brief pullback from
a good, steady, short-term uptrend. 2) A potential cup & handle formation
that was now about six weeks old. By playing the shorter-term pattern
for a day or swing trade, you can set yourself up to possibly benefit from the
longer-term cup & handle, should it materialize.
The trigger
on the pullback would have been a little above yesterday’s high of $28.81.
A reasonable stop would have been beneath yesterday’s low. Now let’s look
at today’s action and see how it could have been played.

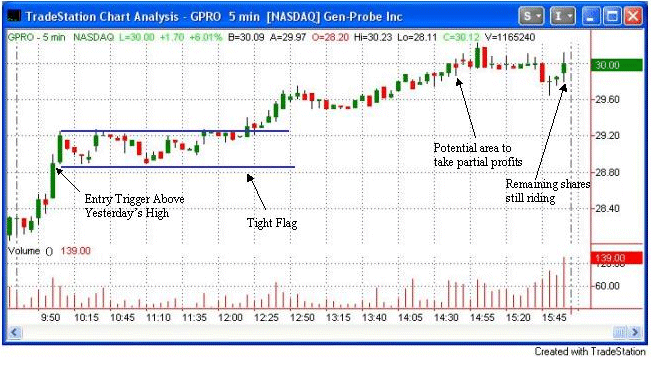
The short-term
trade would have triggered around 10am this morning as yesterday’s high was
taken out. After triggering, the stock only continued higher for a few
more minutes before running out of steam around $29.25. At that point
it began to form a high-tight flag on the 5-minute chart with a low at $28.90
and a high at $29.27. After $28.90 was tested for the second time just
after 11am, the stop could have been moved up beneath the low of that flag.
This would
have effectively meant the position would be scratched if the flag broke down.
Short-term traders could also have considered adding to the position on a break
above the flag high.Once GPRO reached close to $30.00, profits would have equaled
the initial risk on the trade, and a piece of the position could have been taken
off. This would ensure that you are able to lock in some profits.
GPRO finished
the day above $30, and near its highs. It was also just below the high
of the handle formation around $30.43. By taking the trade early, you
could have already locked in a profit, and still have a piece of your position
leftover. If GPRO breaks above the handle as anticipated, your swing trade
then will have intermediate-term home run profit potential. If it doesn’t
break out, you make a profit anyway (barring a big gap down).
By looking
for patterns within patterns like this, you can substantially increase the potential
upside in your trades without taking on additional risk. To consistently
make money in the markets, risk/reward ratios must be skewed substantially in
your favor. This is one way to help increase your risk/reward ratios.
Good Trading,
Rob Hanna
