Ichimoku Models Point South for JPY Pairs
A declining Dow offered no relief for the JPY pairs despite heavy divergence on the daily Momentum readings as the yen gained across every G8 country.
This market is simply has no compunctions about selling the JPY pairs, thus we are totally focused on intraday sell signals on smaller time frames since the general choppiness and reduced ranges intimate at smaller targets and being more nimble.
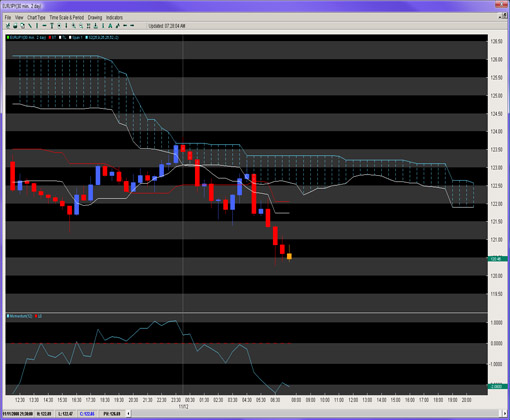
Looking at the 30 minute chart below on the EUR/JPY, we can see how the price action continually resides underneath the cloud or ‘kumo’ and can barely muster a skirmish or two into it with rejections following shortly thereafter.
All of the JPY pairs after yesterday’s sell off produced weak upward crossovers suggesting that as long as the pairs stay below the cloud, a likely strong downward crossover of the Tenkan line (white) and Kijun line (red) below the cloud was sure to follow.
And that is exactly what happened with this pair and all the JPY pairs, many of which sold off 150 pips or more after the crossover. Looking ahead for this pair, the Kumo (cloud) is not declining too much suggesting the pair may re-attack the previous floor around 122.00 but current momentum readings are not confidence builders for intraday bulls.
The Tenkan and Kijun lines offer the first lines of defense posting up around 121.75 and 122.00 flat and will make upward advances tougher while the line of least resistance remains downward.
Figure 1: EUR/JPY 30 Minute Chart
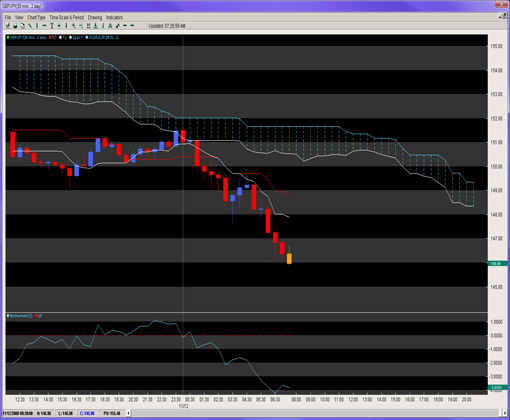
While the EUR/USD has been slowly descending, the GBP/USD has been much weaker in comparison which prompts us to focus more closely on the GBP/JPY cross as the more likely to give us better and longer selling opportunities. The 30 minute chart below on the GBP/JPY shows how this pair really brought in the cabbage selling off over 360 pips since the strong downward crossover of the Tenkan and Kijun lines below the cloud.
Unlike the EUR/JPY, the cloud is declining on this pair but gets a bit thin in the cleft between the NY close and Tokyo open but a 400 pip bounce would be required to offer any threat to the cloud which should act as a ceiling.
Intraday Momentum models suggest the selling should continue and retracements will likely be just that – retracements and opportunities to sell again. Look for a weak upward crossover of the Tenkan and Kijun lines below the cloud which could offer another strong downward crossover of the two lines below the cloud and another selling opportunity.
Figure 2: GBP/JPY 30 Minute Chart
Chris Capre is the Founder of Second Skies LLC which specializes in Trading Systems, Private Mentoring and Advisory services. He has worked for one of the largest retail brokers in the FX market (FXCM) and is now the Fund Manager for White Knight Investments (www.whiteknightfxi.com/index.html). For more information about his services or his company, visit www.2ndskies.com.