Ideal Conditions For The Short-Term Trader
What Wednesday’s Action Tells
You
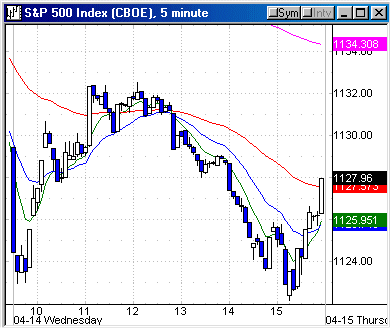
Market action yesterday was dominated again by
the same primary thread we have seen for the last three days. Price and volume
was primarily in the banks, brokers, other related financials and utilities as
they continued their sell-off on the after-the-fact news. The major indices were
off slightly from the previous day, with the SPX closing at 1128.17, -1 1/4
points and the Dow 10,378, -3 points. The Nasdaq finished at 2025, -0.3%, while
the QQQ had a positive divergence at +0.5%, closing at 36.81. NYSE volume
expanded to 1.55 billion, which included some option expiration activity along
with the continued selling in the financials.
The SPY, DIA, and QQQs all traded above their average volume while the SMH,
-0.8%, traded below its average volume. Some more money found its way to
defensive stocks like ABT, +4.2%, JNJ +2.4%, BMY +1.7%, LLY +1.5%,
MRK, +1.9%, CL, +2.4%, in addition to some basics like PH, +3.8%, DD, +3%, and
MIL, +2.6%. The XLB closed green at +0.4%. The allocation adjustment like we are
seeing now creates many good trading opportunities, especially after it gets too
extended or overdone.
Â
| Â | Thur. 4/8 |
Fri. 4/9 |
Mon. 4/12 |
Tues. 4/13 |
Wed. 4/14 |
Index |
|||||
| SPX |
|||||
High |
1148.97 | H | 1147.29 | 1147.81 | 1132.52 |
Low |
1134.52 | 1139.32 | 1127.70 | 1122.15 | |
Close |
1139.32 | O | 1144.94 | 1129.42 | 1128.17 |
% |
-0.1 | +0.5 | -1.4 | -0.1 | |
Range |
14.4 | L | 8 | 20.19 | 10.4 |
% Range |
33 | 70 | 9 | 58 | |
INDU |
10442 | I | 10514 | 10381 | 10378 |
% |
-0.36 | +0.7 | -1.3 | -.03 | |
Nasdaq |
2053 | D | 2063 | 2030 | 2025 |
% |
+0.1 | +0.5 | -1.7 | -0.3 | |
| QQQ |
36.94 | A | 37.17 | 36.63 | 36.81 |
% |
0 | +0.6 | -1.4 | +0.5 | |
NYSE |
Y | ||||
T. VOL |
1.19 | 1.10 | 1.42 | 1.55 | |
U. VOL |
488 | 610 | 153 | 470 | |
D. VOL |
688 | 482 | 1.26 | 1.04 | |
VR |
41 | 56 | 11 | 31 | |
4 MA |
44 | 42 | 36 | 35 | |
5 RSI |
58 | 67 | 40 | 38 | |
ADV |
1199 | 1669 | 419 | 749 | |
DEC |
2042 | 1621 | 2954 | 2626 | |
A-D |
-843 | +48 | -2535 | -1877 | |
4 MA |
-533 | -447 | -850 | -1301 | |
SECTORS |
|||||
SMH |
+0.4 | +0.6 | -1.2 | -0.8 | |
| BKX |
-0.4 | +0.6 | -2.2 | -1.4 | |
XBD |
-0.4 | +0.6 | -2.8 | -1.1 | |
RTH |
-1.5 | +0.7 | -1.6 | +0.3 | |
CYC |
-0.4 | +0.7 | -2.0 | -.05 | |
PPH |
-0.6 | +.08 | -0.8 | +1.5 | |
OIH |
+1.1 | +2.3 | -1.7 | -0.4 | |
| BBH |
+1.2 | -0.3 | -1.6 | +0.4 | |
TLT |
-0.3 | -0.4 | -1.1 | -.08 | |
| XAU |
-1.2 | +0.1 | -6.1 | -1.7 |
For Active Traders
The gap down in the major indices and HOLDRs gave
traders their opportunity. The SPY opened at 112.61 versus the previous 113.21
close. The initial low was 112.57on the 9:35 AM bar, then you got the 1,2,3
Close entry above 112.75 on the 9:50 AM bar, which was preceded by the RST entry
above 112.72 on the 9:40 AM bar. The SPY made a nice contra move up to 113.63 by
11:05 AM. This set up the Slim Jim short pattern which caught the afternoon
trend down. The Slim Jim breakout was below 113.40 and this was also below all
of the 8, 20, 60 and 240 EMAs. The SPY traded down to 112.56 before
trading up to the 113.39 close. (FYI, this was another RST long setup with entry
above 112.74). Net net, it was an RST long and 1,2,3 Close entry
for the contra move, Slim Jim short as price resumed the direction of the
open, so the 90-60 Rule was in play again as it is most of the time. Next was an
RST long that caught the last half hour markup into the close. They are all
defined setups from your
Sequence Course or
seminar material –didn’t matter whether you traded the SPY or the E-minis.
The QQQs gave you the RST long entry on the 9:35 AM bar above 36.49, which
traded up to 36.94 on that 11:05 AM bar.
For Today
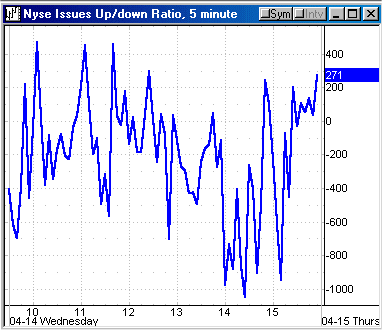
The 4 MA of the volume ratio is now 35 and -1302
for breadth (bloated by the financials) while the 5-day RSI is still a bit high
at 38. There are more economic reports in addition to the earnings releases on
top of this week’s options expiration so that means more emotional price action, which is ideal for the short-term trader. The SPX and Dow are all around the
levels mentioned in yesterday’s commentary, so that will carry over today. The QQQs closed at 36.81, right at the 240 EMA (on the 5-minute chart) and 480 EMA
(equivalent to the 20 EMA on a 120-minute chart) so that is an early guideline
both ways.
Have a good trading day,
Kevin Haggerty


