Identify Reversals and Breakouts with Time Windows
Over the past generation there has been a hot debate on Wall Street as to whether it is possible to time financial markets. Random Walk theorists will have you believe all movement is random. Therefore, in order to catch a move one must be invested at all times. The problem with that approach is your time to invest may not be in sync with the market. Let’s say the day you decide to invest is a week before a long term top. Even though your intention is to hang in there for the long term, your bankroll may not survive.
In my February 20th article, I demonstrated the profound influence Fibonacci and Lucas cycles have on the markets. Had you been aware of these cycles last year you would have known the decade long bull market was approaching the 262 week window where a turn was probable. You would not have bought the top. The more aggressive of you would have advance warning of an excellent shorting opportunity. This article will not only demonstrate market precision, but show you how these time windows act as leading indicators so you can anticipate market turns ahead of the crowd.
The way to use the time windows as leading indicators is to look at charts in more than one time frame. This means keeping track of the candles from more than one prior pivot or in two different time frames. When the candles ‘cluster’ at one of our universal time symmetries, the probability is much greater for a reversal or even a breakout. For intraday traders, a combination of 5 and 15 minute charts lining up in the same area is the recipe for an excellent pivot. In theory, this seems extraordinarily simple, but it isn’t easy. Since are three times as many bars on a 5 minute chart compared to a 15 minute, it stands to reason there are 63-5 minute candles in a 21-15 minute candle wave. When we have a high to low or low to high move, this cluster has a great chance of causing a reversal.
However, we all know real time action isn’t as simple. Many traders or analysts look at cycles from lows (highs) to highs (lows). In reality we must expand our game plan to include low to low and high to high cycles. All are fair game and contribute to our multiple time frame capabilities. Given the fact all time windows are plus or minus one bar, that same pattern could be 34-5 minute bars up and 29 (Lucas) bars down for 63. A 47-5 minute pattern up and 13-5min down for a 60 bar low to low cycle may be 16 (1.618 derivative) 15 minute bars up and 5 down.
But the best way to learn this is to see some examples. Unless you are an intraday trader you may want to pay most attention to the hourly and daily time frames. In a review of recent history, the tech indices experienced a 56 (Fibonacci 55+1) day leg from the October high to the January low. It held for over a month. Our first chart of the NDX highlights these symmetries. For ease of discussion, concurrent relationships on the NASDAQ E-mini (NQ) are annotated on this chart. For instance, from the October 31 high in the (NQ) there was 28 candles (Lucas 29-1) to the December 11 high and then 38 (Fibonacci ratio 38.2) to the December 26th high. In the near term the important cluster to watch was those high to high pivots which completed in a Fibonacci 89 hours. These calculations are derived using the hours from the Futures day session as all calculations eliminate overnight activity.
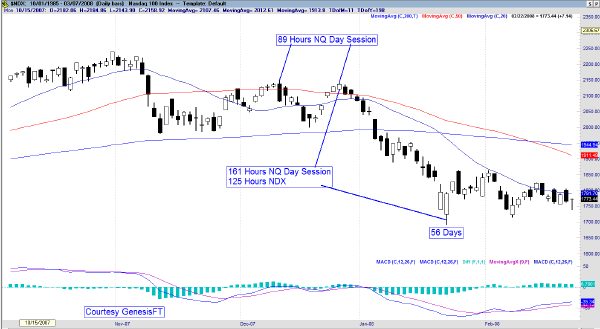
From there, the real part of the move kicked in and didn’t stop until 161 hours expired on January 23rd. On the highlighted NDX chart we find a 125 hour move over the same period which falls right in the middle of the 123-127 hour window. These calculations are derived from Lucas 123 and square root of 1.618 which is 1.27. As you can see, our cluster of time included 56 days for the entire move, but 161 and 125 hours from important secondary pivots. As several time frames clustered, the market decided to change direction. Always keep in mind the inter market relationships between the NQ/ND, NDX and NASDAQ.
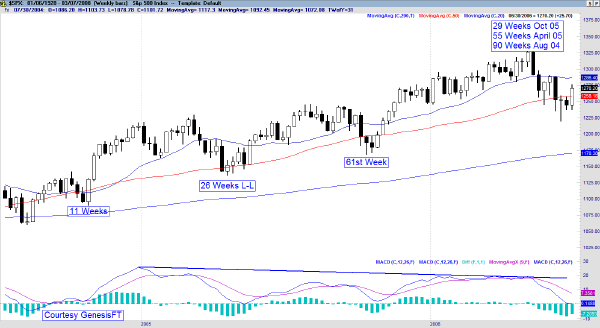
These clusters materialize on small to intermediate level time frames all the time. What is rare is when they materialize on the larger time frames. But we are to utilize these time windows in exactly the same fashion because we are dealing with universal principles. However, the larger time frames are when we can anticipate major turns in the market, perhaps weeks ahead of time. Such an occurrence materialized in the spring of 2006. The next chart is a weekly picture of the S&P500 from the August 2004 low to the May 2006 high. Note there are several low to low cycles that have universal symmetry to the absolute low or the prior important low. Also note how the MACD divergence lingers as the trend continues longer than most participants expect. As a matter of fact, the business media would highlight certain bears that kept shorting this wave prematurely.
Those who understood this methodology at the time saw the cycles lining up in a way they normally do on smaller scales. The difference is that markets were lining up on the longer term weekly time frame. About a month before the top one could see there would be a confluence of time frames lining up in early May. There would come a week where the charts would be 28-29 weeks off the October 2005 low, 54-55 weeks off the April 2005 low and 89 weeks off the August 2004 pivot. Cycles such as these only materialize a handful of times in an entire decade. Knowledge of them will do two things for you. First, if you are long, stay long until we get to the window. Second, if you are thinking of shorting less than ideal fundamentals, wait until the cycle picture gives you the green light. Movements in financial markets are not random. These cycles are like sporting events and continue until the final buzzer sounds. When they finally line up, the game is over, not before that.
What finally happened were markets reversed on a huge bearish engulfing bar at 29 weeks off the October 2005 pivot, 55 weeks off the April 2005 low and 90 weeks off the August 2004 low. Had we scaled down to smaller time frames, we could demonstrate symmetry there as well. It’s also important not to front run the bars. It’s best to get confirmation by a reversal candle formation. As we know, candle reversal formations need to be taken in the larger context of the market. Knowledge of these time cycles gives us the larger context.
In summary, markets are not random. The reality is they are very precise. To take advantage of that precision we need to utilize a methodology that stacks the deck in our favor. We can do that by understanding the unique symmetries which is the language of financial markets. When we realize there is such a language, we look for areas of interest on the chart. These high probability areas include the multiple time frame clusters we’ve highlighted today.
Jeff Greenblatt is a private trader for the past 8 years. He is the author of “Breakthrough Strategies For Predicting Any Market†published by Marketplace Books. He is the director of Lucas Wave International which publishes the Fibonacci Forecaster, a market forecasting service with a circulation of traders and money managers in 17 countries.
Jeff’s technical expertise is Elliott Waves, Fibonacci studies and candlesticks. He has enhanced these methodologies to include The Lucas Series which is closely related to the Fibonacci sequence. Jeff has developed and tested a timing methodology that can be adapted to many disciplines of technical analysis that allows traders and money managers much greater precision on their trading and investment decisions. This methodology is described in the book.
Jeff has written numerous articles and speaks at trading conventions. He is a regular guest on 1510 KFNN Financial News Radio in Phoenix, AZ where he lives. For more information email Fibonacciman@aol.com or visit www.LucasWaveInternational.com.