If We Move Higher, Here Are The Stocks I’m Looking At
The
reflex yesterday presented some intraday trading opportunities,
especially in the
(
SMH |
Quote |
Chart |
News |
PowerRating)s. NYSE volume
was again below 1.3 billion, coming in at 1.295 billion, the volume ratio was
78, and breadth +1187. The SPX
(
$SPX.X |
Quote |
Chart |
News |
PowerRating) ended +1.4%, the Dow
(
$INDU |
Quote |
Chart |
News |
PowerRating) +1.2% and the Nasdaq
(
$COMPQ |
Quote |
Chart |
News |
PowerRating) +1.7%.
The SMHs closed at 25.40,
+4.1%, and down from the intraday high of 25.70. The entry was our basic 1,2,3
with the 9:50 a.m. ET bar being the signal bar with entry above 24.56. The 1
point was the 24.30 low on the 3:55 p.m. bar the previous day. The signal bar
with a 24.43 low was a five-bar pullback to that 24.30 low after yesterday’s
opening bar had traded to a 24.80 high. If you missed that one, and you
shouldn’t have, you got a second 1,2,3 chance with entry above 24.73, the high
of the 10:30 a.m. signal bar. Remember, the early trading activity should always
be looked at relative to the previous day’s low, high, closing range, and
whatever the last leg up or down was. You knew the .50 retracement to the 17.32
October low was 24.16, so that put you on alert for any possible setups. You
can’t know you’re going to get one, but you must anticipate it because markets,
stocks, etc., very often pause or reverse off the key levels, if for only a
trade, before it seeks new levels up or down.
The SPYs closed at 90.70
on an inside bar just above its 50-day EMA of 90.41. The .38 retracement to the
October low is 88.80, and the .50 retracement is 86.50. Monday was a
wide-range-bar close in the bottom of the range, and yesterday was a
narrow-range day with the close in the top of the range. That can very often be
a very negative pattern when a stock or an index is in the process of a
retracement. Monday’s low of 89.48 is the downside magnet. The QQQs have the
same pattern, closing at 25.60, with Monday’s low at 25.20. The 50-day EMA is
25.31, and the 89-day EMA is 25.25.
If you trade the Diamonds
(
DIA |
Quote |
Chart |
News |
PowerRating), Monday’s low is 84.76, the 50-day EMA is 85.34, and the 89-day EMA is
85.61, and they closed at 85.75. The SMH is also right at a key level at the .50
retracement at 24.16, the 50-day EMA at 25.27, and 89-day EMA at 25.81. The SMHs
closed at 25.38. Whether you trade futures, proxies or highly correlated stocks,
we will be busy both ways today around these pivot zones on any or all of the
above.
If we head south today, I
favor index proxies as the vehicle on the shortside, but on the upside, if we go
green, some stocks in pullback patterns in rising trends that I favor are
(
EBAY |
Quote |
Chart |
News |
PowerRating),
(
MSFT |
Quote |
Chart |
News |
PowerRating),
(
SNDK |
Quote |
Chart |
News |
PowerRating),
(
CREE |
Quote |
Chart |
News |
PowerRating),
(
CYMI |
Quote |
Chart |
News |
PowerRating),
(
PCAR |
Quote |
Chart |
News |
PowerRating),
(
ROK |
Quote |
Chart |
News |
PowerRating),
(
HLTH |
Quote |
Chart |
News |
PowerRating),
(
NATI |
Quote |
Chart |
News |
PowerRating),
(
SII |
Quote |
Chart |
News |
PowerRating),
(
BHI |
Quote |
Chart |
News |
PowerRating)
and
(
JBL |
Quote |
Chart |
News |
PowerRating).
Have a good trading day.

Five-minute chart of
Tuesday’s SPX with 8-, 20-,
60- and 260-period
EMAs
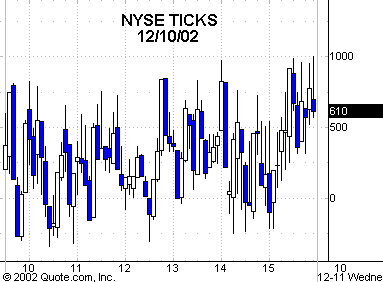
Five-minute chart of
Tuesday’s NYSE TICKS