If You Can’t Explain It, Fibonacci Can
Most people don’t know, and
I don’t either, whether the effect of Fibonacci retracement
levels is purely coincidental or real. As you know, widely known levels are
38.2%, 50% and 61.8%. I have no idea exactly how many traders and investors use
Fibonacci, but we should not ignore it for the simple fact that I have seen,
numerous times, stocks bounce when they reached near Fibonacci levels. Let me
give you some examples.
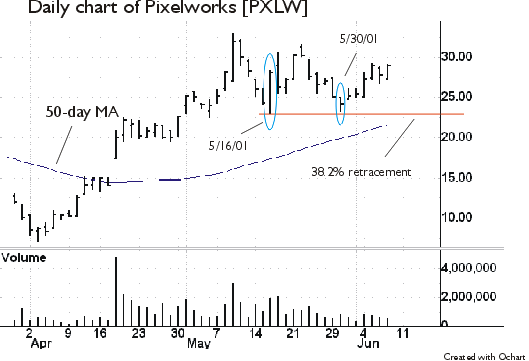
Here is a daily chart of Pixelworks (PXLW).
The red horizontal line is a 38.2% retracement level of the April 3 low to the
May 9 high. Mysteriously or expectedly, the stock successfully bounced off the
level twice on May 16 and May 30. It may be a simple case of attempting to rally
out of a pullback, but still, the fact is it happened near the Fibonacci level.

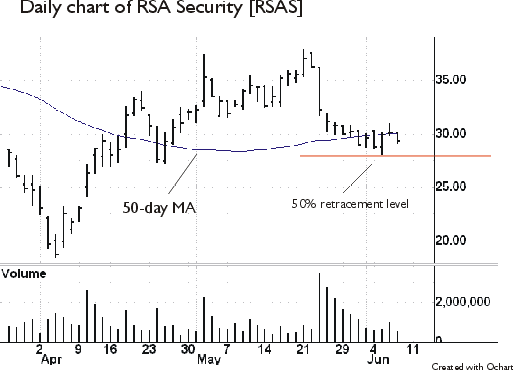
RSA Security (RSAS)
broke down below its 50-day moving average on May 31, but its downward move was
temporarily halted at the 50% retracement level of the April 4 low to the May 21
high as you can see below.

If you can’t explain your stock’s behavior, the chances
are pretty good that your stock is trading near the Fibonacci level.
