If You Trade The S&Ps, Make Sure You Have These Charts
What Wednesday’s Action Tells You
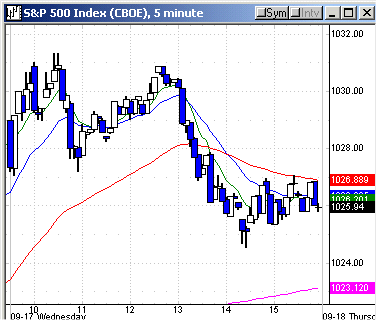
It was a choppy day yesterday with no follow
through by the Generals to take the major indices to new highs. The SPX
(
$SPX.X |
Quote |
Chart |
News |
PowerRating) closed at 1025.97, -0.3%, with an intraday high of 1031.34.
Since Sept. 3, over the past 11 trading days there have been intraday highs
between 1029.17 and 1032.41 on seven of those days, so some resistance has been
built up, and it is the obvious upside magnet.
“The game” didn’t materialize yesterday afternoon
after the intraday low for the SPX of 1024.53 on the 2:25 p.m. ET bar, which was
in the .618 1024.15 retracement zone between Thursday’s last swing point low of
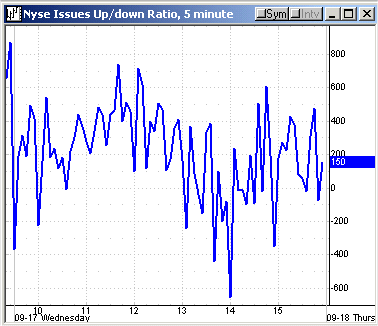
1019.70 and yesterday’s high of 1031.34. There were a few buy programs that came
in as NYSE TICKs jumped, but the market wasn’t accelerated as the SPX only
traded to a 1027.06 high, then closing at 1025.97. The Dow
(
$INDU |
Quote |
Chart |
News |
PowerRating) closed
at 9546, -0.2% on the day as it tries to get through that 9600 first resistance
level which was highlighted with charts in previous commentary (see the Aug. 29
commentary). The Nasdaq
(
$COMPQ |
Quote |
Chart |
News |
PowerRating) also closed -0.2% at 1883, with the
(
QQQ |
Quote |
Chart |
News |
PowerRating)s at 34.24, -0.5%.
In the major sectors, the only thing that got my
attention was the weakness in the basic industry stocks, with the XLB -1.5%,
when at the same time the
(
TLT |
Quote |
Chart |
News |
PowerRating) — the long bond proxy — was +1.2% and
(
LQD |
Quote |
Chart |
News |
PowerRating) — the corporate bond proxy — +0.7%. Gold was also up, with the XAU
+0.8%. The XLBs are +41% since the October lows, and portfolio managers are
probably getting a bit antsy as price advances but earnings are slow to follow,
so ringing the register and changing their allocation until they see some
earnings verification makes sense. Besides that, expectations for smokestacks
are not nearly as high as it might be for other industries. Until that current
rollover top on the XLB is broken to the upside, some of these basics should be
a source of intraday shorts against other intraday longs in better-positioned
stocks. NYSE volume was 1.3 billion, volume ratio 48, and breadth also neutral
at -173.
For Active Traders
The best trade vs. the SPX yesterday was taking
the double top short entry below 103.66 in the
(
SPY |
Quote |
Chart |
News |
PowerRating), which was an outside
reversal signal bar. The SPY traded down to 103.06 on the 2:25 p.m. bar, which
was a hammer bar reversal and that was also the intraday low. The signal bar for
the SPY was the 12:40 p.m. bar, but the E-minis didn’t give you the same look
that would have made you take the trade. Trading the S&P futures for best
performance means you should also have the SPX cash and SPY charts on your
monitor to read. Derivatives are traded off the cash index, not by themselves,
as many of you new traders seem to think. Trading strategies are no different
for SPY or E-minis than they are for the SPX cash.
(
IBM |
Quote |
Chart |
News |
PowerRating), one of yesterday’s focus stocks, was a
good trade from my First Hour Reversal Strategies. It opened at 90.40, traded
down to 90.20 on the first bar, closing at 90.27. The opening reversal was on
the second bar, trading above 90.40, which was also the high, in addition to
being the previous day’s high. Under standard Opening Reversal guidelines, you
wouldn’t normally take the opening reversal on the second bar, but this was
taken because it was coming out above the 90 level to new highs having closed
the previous day at 90.29. The previous high was also 90.40 on May 14. It was a
good probe/trade to take because in addition to any hedge fund acceleration
against institutional order flow in IBM, it would probably get the retail sheep
that follow the stock services, most of which were highlighting IBM above 90.
The stock traded up to 91.94 before it faded,
trading down to 90.63 and closing there. IBM had some significant volume on
Thursday from 3:20 p.m. into the close from 89.50 up to 90.40 and closing at
90.29. That means that the 90 level was being muscled, but after yesterday’s
surge and retreat it becomes even more interesting on the retracement back to
the breakout level, so stay involved on a daytrading basis.
Today’s Action
The upside magnet is getting through that 1029 –
1032 zone. On a daytrading basis, if you look at the SPY 60- or 30-minute charts
since the Aug. 6 bottom of 96.34, you are looking at double tops of 103.88 and
103.79. Downside short bias using my filters is below 103.08, then again below
102.85. These are both dynamic numbers and will change daily. But if short
trades are taken, the filter levels then become immediate upside stop levels,
which is how you enter a trade at the lowest common denominator for the best
risk/reward.
Have a good trading day,
Kevin Haggerty


