If You’re Long The Minis, Watch This Price Level
Stock index
futures opened Tuesday’s session slightly better again after a quiet overnight
session and no surprises in June Personal Income and Spending. After June
Factory Orders came in as expected, good enough broker buying, also helped along
by a buy program, came into the SPoos to gun through Monday’s highs and hit a
good number of buy stops. There was a rumor that MSFT would issue another
special dividend, but it was probably more of an excuse to explain the run-up,
for a lack of anything better. A choppy range ensued for the next 5 hours,
giving some tight scalps, before the ES surged to a new session high just before
the cash close.
The
September SP 500 futures closed out Tuesday’s session with a gain of +.75 point,
while the Dow futures showed relative weakness with a loss of —46 points.Â
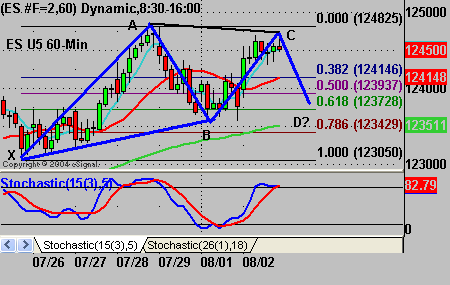
Looking at the daily charts, the ES reversed off of its 10-day MA support, but
fell just short of testing last week’s high. The YM posted a market structure
low and was able to settle back above its 10-day MA again. On an intraday
basis, the ES reversed back off of its broken 60-min downtrend line, which acted
as support, while the YM broke its 60-min downtrend line. Both contracts could
be forming bullish Gartley patterns, which would confirm on Wednesday. For
you daily 3-Line Break followers, the ES barely remains long with a Break Price
of 1236.50, and needs to close above 1247 to post a new line, while the YM
remains long with a Break Price of 10598.

Wednesday
morning at 10:00 ET gives us the July non-manufacturing ISM number, which is
expected to post a small downtick to 61.0, but still shows growth in the
sector. The weekly API and Energy Dept. numbers will be released at 10:30 and
hopefully will be a little less confusing than last week when one reported a
draw in crude supplies while the other reported a build in inventories.
Human
Behavior — The Greatest Barrier to Trading Success
Have you ever held on to a trade too long, in the vain hope it
would return to the price at which you bought it, even though you knew in your
gut that this was unlikely to happen? Well, you’re not alone.
It is suggested a lot that one of the biggest problems facing human traders is
that they tend to be overconfident in their view of things. Not just “robustly”,
but “wildly” overconfident. The following statistical examples are provided:
– 82% of people say they are in the top 30% of safe drivers;
– 86% of Harvard Business School students say they are better-looking than their
classmates;
– 68% of lawyers in civil cases believe their side will prevail;
– 81% of new business owners think their business has at least a 70% chance of
success, but only 39% think any business like theirs would be likely to succeed;
– Mutual fund managers, analysts, and business executives at a conference were
asked to write down how much money they would have at retirement, and how much
the average person in the room would have. The average figures were $5 million
and $2.6 million respectively.
Overconfidence is explained by suggesting that people generally remember
failures very differently from successes. Successes were due to one’s own wisdom
and ability, while failures were due to forces beyond one’s control. Thus,
people believe that with a little better luck or “fine tuning,†the outcome will
be much better next time. Just some food for thought.
       Â
Â
Daily Pivot Points for 8-3-05
| Symbol | Pivot | Â Â Â Â Â R1 | R2 | R3 | S1 | S2 | S3 |
| INDU | 10668.80 | 10714.13 | 10744.52 | 10789.85 | 10638.41 | 10593.08 | 10562.69 |
| SPX | 1241.50 | 1247.31 | 1250.49 | 1256.30 | 1238.32 | 1232.51 | 1229.33 |
| ES U5 | 1243.25 | 1249.50 | 1253.75 | 1260.00 | 1239.00 | 1232.75 | 1228.50 |
| SP U5 | 1243.77 | 1248.73 | 1252.17 | 1257.13 | 1240.33 | 1235.37 | 1231.93 |
| YM U5 | 10674.67 | 10715.33 | 10748.67 | 10789.33 | 10641.33 | 10600.67 | 10567.33 |
| BKX | 100.51 | 100.85 | 101.05 | 101.39 | 100.31 | 99.97 | 99.77 |
| SOX | 483.54 | 489.00 | 491.80 | 497.26 | 480.74 | 475.28 | 472.48 |
Â
Weekly Pivot Points for Week of 8-1-05
| Symbol | Pivot | Â Â Â Â Â R1 | R2 | R3 | S1 | S2 | S3 |
| INDU | 10666.52 | 10692.12 | 10743.34 | 10768.94 | 10615.30 | 10589.70 | 10538.48 |
| SPX | 1235.83 | 1243.50 | 1252.83 | 1260.50 | 1226.50 | 1218.83 | 1209.50 |
| ES M5 | 1238.67 | 1246.83 | 1256.92 | 1265.08 | 1228.58 | 1220.42 | 1210.33 |
| SP M5 | 1238.53 | 1246.27 | 1255.73 | 1263.47 | 1229.07 | 1221.33 | 1211.87 |
| YM M5 | 10663.67 | 10748.33 | 10819.67 | 10904.33 | 10592.33 | 10507.67 | 10436.33 |
| BKX | 100.48 | 101.13 | 102.37 | 103.02 | 99.24 | 98.59 | 97.35 |
| SOX | 472.73 | 479.53 | 484.62 | 491.42 | 467.64 | 460.84 | 455.75 |
Â
Please feel free to email me with any questions
you might have, and have a great trading week!
Chris Curran
Chris Curran started his trading career at the
age of 22 with a national brokerage firm. He combines fundamentals and
technicals to get the big picture on the market. Chris has been trading for 15
years, starting full time in 1997, and has never had a losing year as a
full-time trader.
