I’m becoming more bullish, here’s why
Bullish and Not Overbought
The S&P 500 closed above its 200-day simple
moving average early last week and rallied firmly above it to close at 1220.14
on Friday. This is also a close firmly above its’ 50-day moving average. I am
becoming more and more bullish, but we still need confirmation from the New York
Stock Exchange Bullish Percent Index in order for me to be firmly in the bullish
camp.
What sectors are looking good here? I am watching
the Broker Dealers, Transports, Software, and Biotech to be the leaders in the
fourth quarter rally. We have come so far just this past week, with the S&P 500
up 1.83%, the Dow up 1.23%, and the Nasdaq Composite up 3.82%, is it still OK to
buy now? As a technician, that is a predicament I often face. The markets need
to rally in order for technical indicators to change to indicate bullishness,
yet, once the market has rallied enough for them to change you may wonder if the
rally will continue.
One thing that can be of some use when deciding
whether or not to purchase a stock is an evaluation of the level of its Relative
Strength Index (RSI) chart. The RSI is an oscillator that moves from one extreme
to the other and can help determine whether or not a particular stock or index
is oversold or overbought. I am not going to go into the composition of the
Relative Strength Index in this column, I am just going to interpret it. There
are many resources on the web in order to get a definition. Many technicians
assign firm values to the oscillator and determine that a reading over 70 is
overbought and that a reading below 30 is oversold. I view it as a little bit
more complex, and use it in conjunction with point and figure charts to
determine entry point.
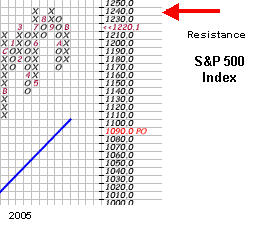
Let’s look at the chart of the S&P 500 as
representative of a somewhat broad group of stocks and determine whether or not
it would be prudent at this juncture to purchase an exchange traded fund (or
regular mutual fund) that follows the S&P 500.

There is some significant resistance at 1240.
However, that is a good 1.63% away from where we are now. Can we afford to not
be involved until the resistance is tested? Probably not. The closest stop point
is 5.17% away. Are you willing to risk a loss of 5.17% in order to gain 1.63%
(assuming that the S&P fails at the 1240 level as it has twice in the past
already)? Most people would say that it was not worth the risk. If only it were
that simple. Suppose that the S&P rallies from here and breaks through the
resistance? You could be missing a primo buying opportunity. I need a little bit
more help on this one so I am going to consult the RSI for the S&P 500.

The Relative Strength Index, using the commonly
accepted 14-day period, currently resides at 58.6. Technically, not overbought.
In relation to where it has been in the past, the Index does not seem to be
overbought here either. It actually has also been able to go above the value of
54.30 that it hit at the end of September.
Using these two tools, the S&P 500 does not seem
to be overbought here and we are likely to go farther, and, will likely get a
reversal to positive on the New York Stock Exchange Bullish Percent Index. This
does not mean that individual stocks are not overbought, just the broader
market. Still pick carefully and pay close, close attention to sectors.
Sara Conway is a
registered representative at a well-known national firm. Her duties
involve managing money for affluent individuals on a discretionary basis.
Currently, she manages about $150 million using various tools of technical
analysis. Mrs. Conway is pursuing her Chartered Market Technician (CMT)
designation and is in the final leg of that pursuit. She uses the Point and
Figure Method as the basis for most of her investment and trading decisions, and
invests based on mostly intermediate and long-term trends. Mrs. Conway
graduated magna cum laude from East Carolina University with a BSBA in finance.
