I’m bullish when I look at this monthly chart…
Market
View:
The past
week’s financial market action was wild, to say the least. As we have said
numerous times before, the sideways doldrums cannot last forever. Some unknown
catalyst will arise and kick indexes out of their comatose range.
A number of factors
contributed to the sell-off last week. Fedspeak hinting of further rate hikes
was one primary catalyst. Oil prices dropping several dollars and crushing
commodity-related stocks also pressured the Dow and S&Ps. Anticipated tax-loss
selling and year-end rebalancing for mutual funds probably contributed to the
high volume when sell stops below 200-day moving averages broke down.
With all that said, where
do trend charts sit in relative bias right now? Did Thursday’s bungee of layers
of key support mark the near-term bottom? Is there more selling to go? Have we
entered a new trend downward, or is this shaking out weak hand longs for the
next push higher into year’s end?
Come along with me thru the
big chart picture and we’ll see what we can decipher from here…

Much ado has been made about
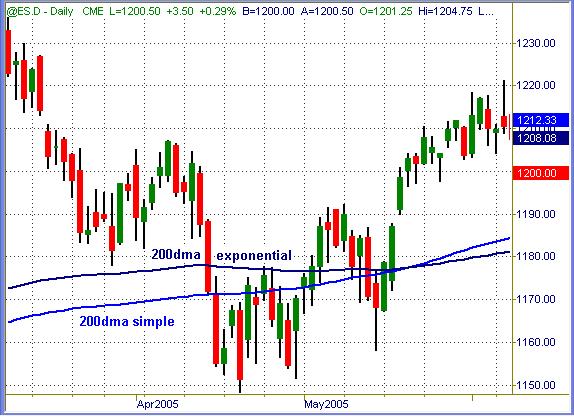
indexes breaking below their 200-day moving average values. I added the simple
(light blue) and exponential (navy blue) lines to see what happened when they
broke down last time. From mid-April to mid-May, those values magnetized price
levels on both sides alike.
From the breaks to subsequent
lows, ES shed -30pts before rallying nearly +100pts from lows to subsequent
highs. There was some very good trading action inside this period, but on a
trend-trade basis that stretch from downside to upside MA value breaks was
sideways and benign.

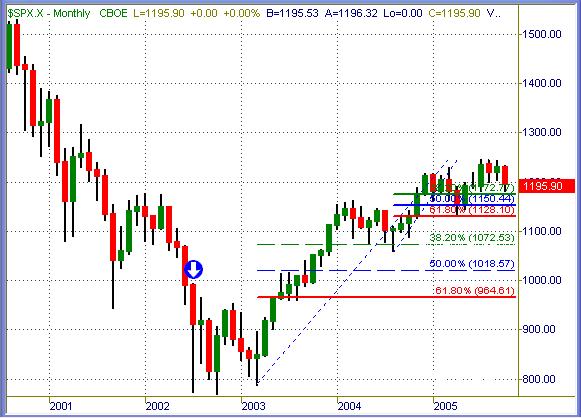
Bullish perspective: the
monthly chart for S&P 500 shows us many different things. First of all, it has
been a very methodical climb from early 2003 lows (Iraq invasion) to recent
highs. Lowest level of pertinent support right now is roughly 1128, followed by
1072 and lower from there. It is not out of the question for prices to hit 1018
or even 965 before a years’ long bounce ensues from there. Adjust your eyes &
mind here… this is a monthly chart.
Second observation: year 2004
and year 2005 were the most sideways consolidation we’ve seen in a long time.
Notice the ranges from 2000, 2001 and 2002? Heck, one single month (July 2002)
spanned over 200 index points in travel range. By comparison, 2004 barely
spanned 100 points in twelve months’ time, and this year may not break much more
than 120 points current range in 9.25 months booked behind us.

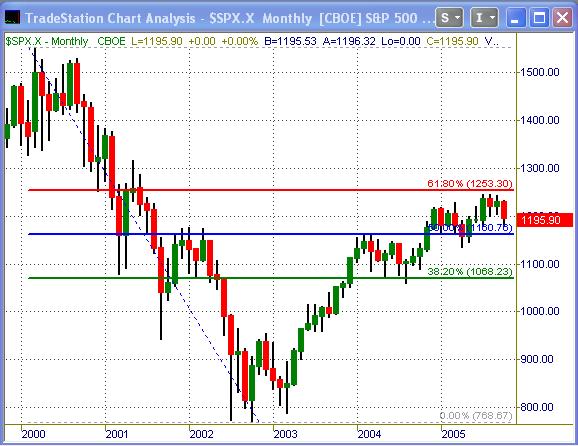
Connecting the dots from
all-time highs in early 2000 thru recent lows in 2002 has price action tapping
within 10 index points of 62% retrace in July, August and September. Unless the
bulls post one helluva rally by Halloween, this three-month pattern will not
mark a fourth test up there.
In 2004 the index
bull-flagged higher. In 2005 it also bull-flagged higher, twice so far. If the
1254 level is taken out on a monthly close, 1300+ is probable by New Year’s.
That is the next big mark where sell stops will cluster into any potential rise
near there.

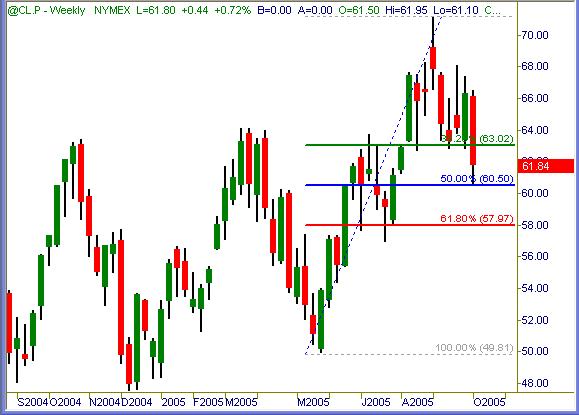
“Black Gold” bled red last
week, down roughly $5,000 per futures contract from high to close. Still, 50% of
the current swing (and other technical support) held fast in the test. $58 per
barrel may soon be seen, where clustered buy stops rest, just waiting for that
scenario to play out.
Free weekly trend view report for stock index
markets here
Trade
To Win
Austin P
Austin Passamonte is a full-time
professional trader who specializes in E-mini stock index futures, equity
options and commodity markets.
Mr. Passamonte’s trading approach uses proprietary chart patterns found on an
intraday basis. Austin trades privately in the Finger Lakes region of New York.
