Improvement Still Slow
Last
week it was starting to look like a better environment for investing
in growth stocks was developing, if only the Dow and S&P could break
strongly above 200-day moving average resistance on good volume and breadth
continued to widen at the mid-week pace. We
still need the breakouts and the breadth. So
we’re waiting and watching. Some
critical tests remain, and we’ll need more broad-based rallies filled with a
lot more breakouts than we’ve had to date to get REALLY excited about
this market.

The
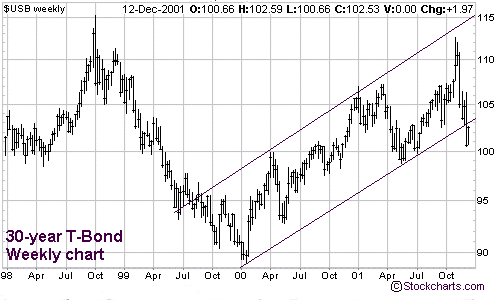
long bond DID break its trend-channel support, which is very significant.
It has popped back into the channel now, but new lows from here will give
a VERY clear indication that the markets are looking to recovery of some
sort. We would still like to see the Dow
break out through 10,200 and the S&P at least over 1185 as well on good
volume to confirm the Naz breakout of last week.

The
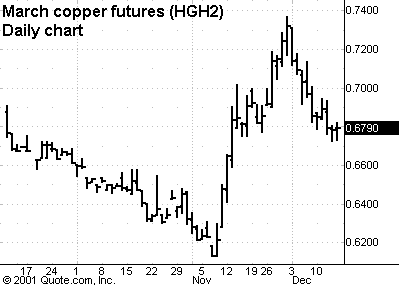
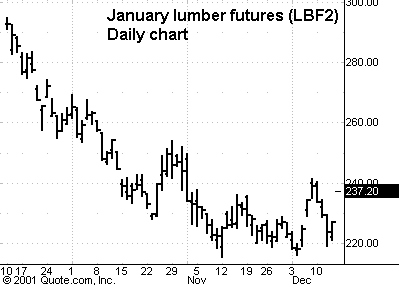
correction this week in commodities has been pretty sharp, and it appears copper
and lumber may be undergoing all-out retests of their lows.
But with the significant bounces we can at least contend that commodities
are probably basing, a prerequisite to the broad array of markets discounting
recovery. We’ll be much more confident
when economically sensitive commodities actually BREAK OUT of decent
bases, but this action is a vast improvement over the consistent crashes we’ve
seen since August.Â

Let’s
look at the breadth numbers on our lists for the week.
Breadth and leadership are IMPROVING, but not quite where we would
normally expect them to be at the beginning of a sustainable move that will take
growth stocks for a nice ride. Top
RS/EPS New Highs vs. Bottom
RS/EPS New Lows for the latest week were 33/2, 20/2, 25/3, 18/5 and 14/8.
Still not a whole week with 20 or greater new highs, but getting closer.
Leadership on new lows continues to be dead.
Breakouts vs. breakdowns of four-plus-week consolidations on our lists
for the week were 7/0, 2/1, 5/0, 0/2 and 4/1. This
means we had 18 breakouts to new highs of decent bases on the whole week —
still not anything close to a lot of opportunities.
For comparison, during the 1999-March 2000 rally, we had 25+ breakouts a
day on average for weeks at a time. We
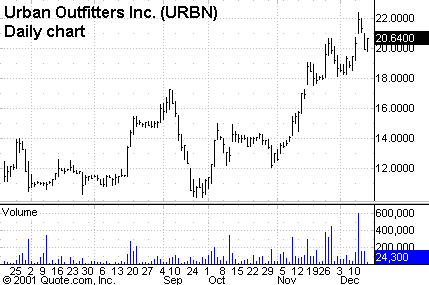
did have a couple close calls on the long side and a long trade in the leading
retail group in
(
URBN |
Quote |
Chart |
News |
PowerRating). Without
clearer leadership, more breakouts by leading stocks and groups, and broader
breakout participation, this move will be difficult to capture with substantial
risk/reward.Â
Our
overall allocation remains DEFENSIVE with 68% in T-bills awaiting new
opportunities. For year 2001, we are
now up about 14.26%, with a heavy cash position.Â
For
those not familiar with our long/short strategies, we suggest you review my 10-week
trading course on TradingMarkets.com, as well as in my book “The
Hedge Fund Edge,” my course “The Science of Trading,” and video
seminar most of all, where I discuss many new techniques.
Basically, we have rigorous criteria for potential long stocks that we
call “up-fuel,” as well as rigorous criteria for potential short
stocks that we call “down-fuel.” Each
day we review the list of new highs on our “Top RS and EPS New High
list” published on TradingMarkets.com for breakouts of four-week or longer
flags, or of valid cup-and-handles of more than four weeks.
Buy trades are taken only on valid breakouts of stocks that also meet our
up-fuel criteria. Shorts are similarly
taken only in stocks meeting our down-fuel criteria that have valid breakdowns
of four-plus-week flags or cup-and-handles on the downside.
In an environment unclear directionally, we also only buy or short stocks
on leading or lagging industries according to our group and sub-group new high
and low lists. We continue to buy new
signals and sell short new short signals until our portfolio is 100% long and
100% short (less aggressive investors stop at 50% long and 50% short).
In early March of 2000, we took half profits on nearly all positions and
lightened up considerably as a sea change in the new-economy/old-economy theme
appeared to be upon us.Upside
breakouts meeting up-fuel criteria (and still open positions) so far this year
are: Possis Medical
(
POSS |
Quote |
Chart |
News |
PowerRating) @15.3 (18.36) w/14.75 ops; Central European
Distribution
(
CEDC |
Quote |
Chart |
News |
PowerRating) @10.3 (10.88) w/8.65 ops; Ryland Group
(
RYL |
Quote |
Chart |
News |
PowerRating) @64.3
(67) w/55 ops; and new entry Urban Outfitters
(
URBN |
Quote |
Chart |
News |
PowerRating) @21.9 w/18 ops.
If we get two or more of our breadth criteria for the overall market
developing from here on, we’ll also then drop the “two per week only”
advice on longs — but until that develops, we’re letting this market prove
itself.

On
the short side, this year we’ve had breakdowns from flags (one can use a down
cup-and-handle here as well) in stocks meeting our down-fuel criteria (and still
open positions) in: NONE.
Continue to watch our NL list daily and to short any stock meeting our
down-fuel criteria (see 10-week
trading course) breaking down out of a downward flag or down cup-and-handle
that is in a leading group. The oversold
nature of the market leads us to suggest that investors remain cautious by
only adding two shorts in a week.
Let’s
watch and see whether we get more consolidation before a real breakout in
averages and breadth or whether the market will undergo a bit more backing-and-filling
retest action before the environment really changes and good opportunities are
abundant again via this methodology. NOW
is the time to PAY CLOSE ATTENTION.
