In The V-Band Zone
The
early futures are green trying to get something started. Yesterday
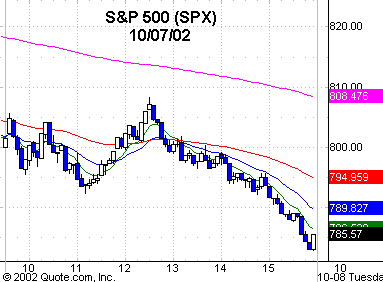
I said the ideal scenario was to take out the 775.68 low, then reverse, but that
was too perfect a scenario. The SPX
(
$SPX.X |
Quote |
Chart |
News |
PowerRating) did trade down to a 782.96
low, closing at 783.07. The 1.27 extension of the 800 – 852 up leg is 785.96,
and 785 is a Square of Nine number. 782.68 is the 1.618 extension of the 792.43
– 808.21 leg on yesterday’s five-minute chart, so there is some symmetry around
this level. Below this zone there is a stronger confluence at 765 – 770, which
includes a 3.0 intermediate standard deviation band.
In Friday’s commentary, I
said that I would like to see more lows into Monday or Tuesday, which
corresponds to a minor cycle period, and then look for a tradable reflex of more
than a day or two. The major indices are also in that -15% to -20% zone below
their 30-week moving averages where you most often get snapback rallies which
send shorts to cover some of their action, especially now as we are in the
20-year and four-year cycle period. Nothing to discuss on that as we have
anticipated this period for at least six months, and I have prodded you to have
a plan which is commensurate with your risk profile.
For sequence traders, you
got two nice RST trades yesterday. The first was a buy pattern with entry above
793.83 on the 11:15 a.m. ET bar. It ran to 808.21. The 4, 3, 2 and 1 points were
on Friday. (See your two-day five-minute chart.) The sell entry was below 806.24
on the 12:35 p.m. bar, and this proved to be the moonshot that carried down to
the 782.96 intraday low. Going forward, I will no longer be mentioning the RST
levels, but will mention how many RST entries were available on a given day so
you sequence traders can see if you recognize the number of trades I mentioned
so that you can test your skills learned at the seminar and from the tapes.
In the sectors, the BKX
declined 4.1% and is now -16.5% for the last four trading sessions. The brokers
are -15.2% for the same time frame. The SOX was -3.1% yesterday and is -12.5%
for the four days. The BTK ended +0.6% on the down day, which is good.
The longer-term slow
stochastics on the weekly chart are in the 20 zone, and just 23% of NYSE stocks
are above the 200-day moving average, along with the discount to the 30-week
moving averages for the major indices. Yesterday’s decline was on 1.5 billion
shares, the lowest volume in the past five days, a volume ratio of just 17, with
breadth an extreme -1745 for a four-day average at a very oversold -1240.
Whether they take out the
SPX July low first, then we get a reflex, or if they can get it going right here
is not our problem because our strategy remains the same. You take the intraday
long setup in the proxy/HOLDRs and stay with it only if there is a sufficient
profit cushion at day’s end. That is only for those position traders that are
trying to catch a swing in case it’s like the previous +25% rally in July. Pure
intraday traders don’t have to make that decision.
News in Iraq ruled the
tape, along with the Program Gang, but we are down to extreme bands and
volatility will revert to the mean, so there is money to be made on any reflex.
Have a good trading day.

Five-minute chart of
Monday’s SPX with 8-, 20-,
60- and 260-period
EMAs

Five-minute chart of
Monday’s NYSE TICKS
