In Trending Markets, Use These Candlestick Continuation Patterns
If you want to be popular and respected among traders, call every reversal point
accurately. Warn traders when the top is forming, and inform people to prepare
for the bottom. If you can do that with pinpoint accuracy, I
guarantee that you will be a star. You will be the most sought-after person in
the trading community.Â
The Engulfing pattern, the Harami pattern, the Shooting Star, Morning and Evening
Star patterns — all these reversal candlestick patterns are supposed to be
excellent ways of detecting important bottoms and tops. More than a few years
ago, I read a report that said, “The candlestick charting technique does not have
unfair advantages over other charting methods. The accuracy of candlestick
charting technique is 50/50, or worse, depending on which market you are trading
in.” I’m not trying to discredit candlesticks. In fact, I encourage you
to use them as part of your decision-making process. It is always wise to get
as many confirmations as possible before committing your money. Remember,
multiple signals are better than one signal. Â
Today, I want to talk about continuation patterns of candlesticks. As you know,
strong stocks cannot go up forever without taking a rest. They have to pull back
from their highs before resuming their uptrend. This is the main idea behind continuation candle patterns. They are designed to detect when strong or weak
stocks are taking a rest. It is just like the popular 1-2-3-4. Let’s begin
with the Rising Three Method.
The
Rising Three Method
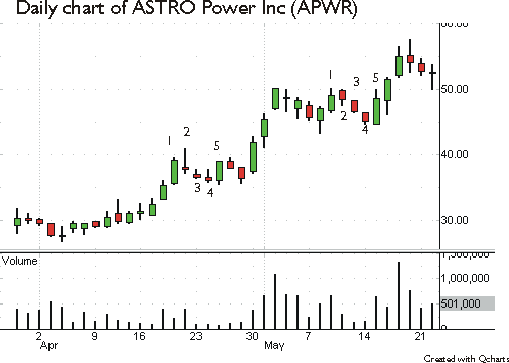
On this daily chart of ASTRO Power [APWR|AWPR], I want you to focus on
numbers 1 through 5. This is what the Rising
Three Method looks like. For it to be effective, some traders insist that Day 5’s
close must be
higher than Day 1’s high, and Day 4’s low cannot go below the low of Day 1. I don’t think
this is really necessary, and do not wish to restrict myself too much when I trade. Since this pattern
consists of five candlesticks, I think some leeway should be allowed.
First, we need to confirm a stock is in an uptrend. The number 1 bar must be an
up day with its open near the low and its close near the high. The numbers 2, 3,
and 4 are pullback bars with small real bodies, and the color of the real body
is not important. The number 5 bar is a bullish engulfing line that wraps almost
entirely the previous down bars. A conventional buy entry will be made when the stock
takes out the high of the number 5 bar. This is where I disagree. If you are a
follower of the 1-2-3-4 method, you would be a buyer of this stock on Day 5. You can safely buy this stock when it trades above the high of the
number 4 bar. Â

The Falling Three MethodÂ
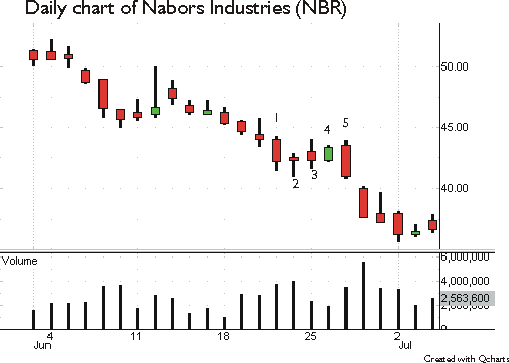
The opposite of the Rising Three
Method can be seen on this daily chart of Nabors Industries
(
NBR |
Quote |
Chart |
News |
PowerRating). I would like you to take a look at
numbers 1 through 5. The number 1 bar has to be a down day with its open near the high
and its close near the low. The numbers 2, 3, and 4 are pullback bars with small
real bodies. Some traders demand that the color of the small real bodies be the opposite of
Day 1. The number 5 bar is a bearish engulfing line that
almost wraps all prior three bars. Your sell entry comes when the stock falls
below the low of the number 5 day. Again, if you are a typical pullback player,
you would not wait that long. In fact, you sell the stock when it trades below
the low of the number 4 day.Â

I want you to be a flexible trader.
In actual trading situations, as you know, textbook-perfect shapes and
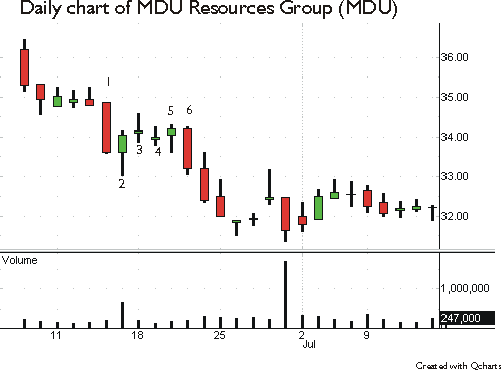
patterns rarely develop. Here is a daily chart of MDU
Resources Group
(
MDU |
Quote |
Chart |
News |
PowerRating).
As you can see, it appears to be forming the Falling Three Method, but if you
count correctly, it has four small real bodies. The number 6 bar is a bearish
engulfing line that almost covers all previous four small bodies. Don’t be too
textbookish. Rather, be flexible. After all, a textbook is a textbook.

Good luck and happy trading.
For The Best Trading
Books, Video Courses and Software To Improve Your Trading
