Index and Energy 1st Hour Reversals
Kevin Haggerty is a full-time
professional trader who was head of trading for Fidelity Capital Markets for
seven years. Would you like Kevin to alert you of opportunities in stocks, the
SPYs, QQQQs (and more) for the next day’s trading?
Click here for a free one-week trial to Kevin Haggerty’s Professional
Trading Service or call 888-484-8220 ext. 1.
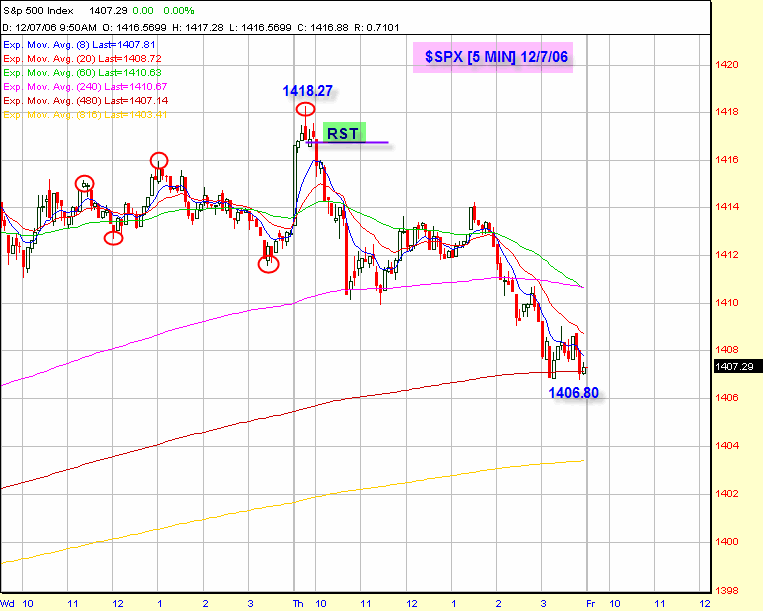
The major indexes gapped up and made the intraday highs on the
9:45 AM bar and then trended down into the close. The $INDU hit 12360.75
versus the previous 12361 cycle high and reversed down 83 points to close at
12278 (-0.3%). The cycle closing high for the $INDU was 12343 on 11/17/06.
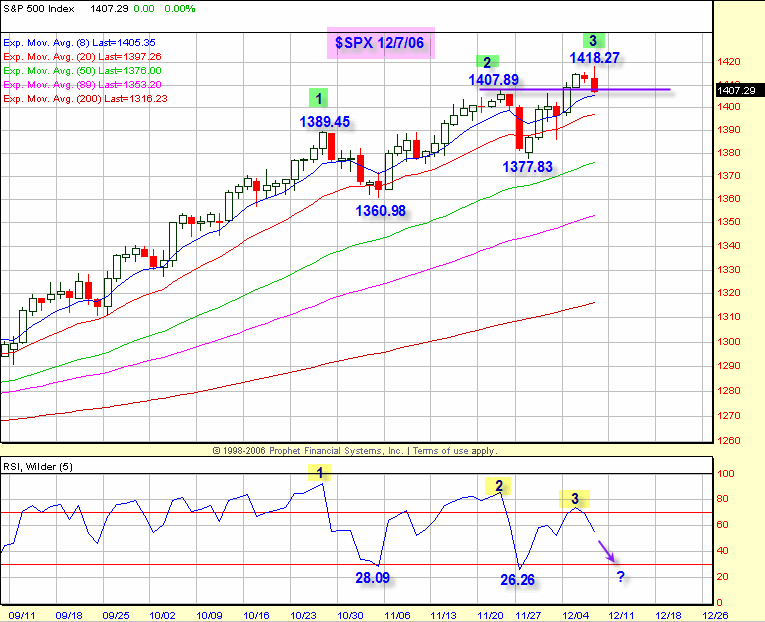
There was an SPX RST short opportunity after the SPX made a new 1418.27 high on
the 9:45 AM bar, and it then traded down to the 1407.29 close (-0.4%). It
was an outside reversal bar that reversed two lows and three closes. The
QQQQ RST short entry below 44.40 traded down to the 43.70 close, -1.3% on the
day. It was an excellent trading day in the indexes after the two previous
narrow-range days. If there is some continuation weakness into next week,
it will be a positive for the year-end “mark-up games.”
NYSE volume was on the light side at 1.45 billion shares with
the volume ratio 37 and breadth -577. The internals turned negative in the
afternoon. Sector action was all red except for gold, with the $HUI +0.7%.
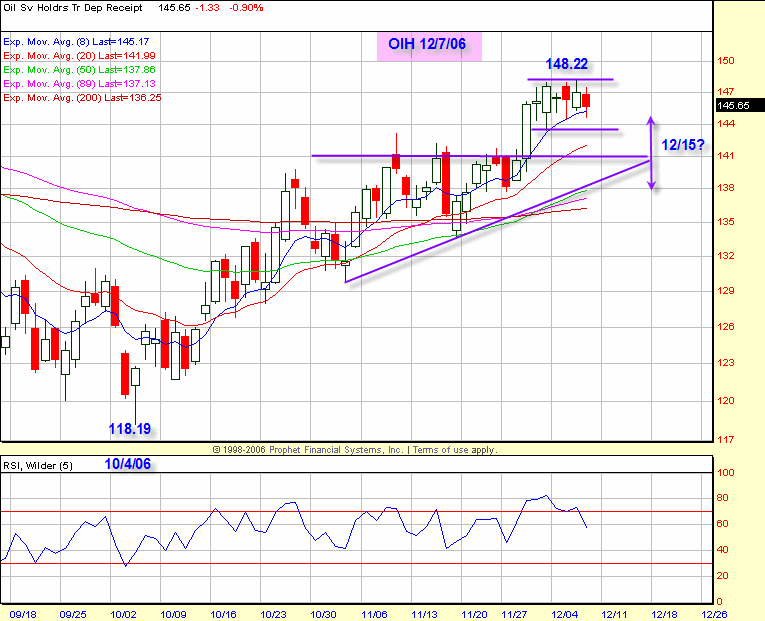
The energy stocks declined early, and this set up some 1st Hour Trap Door long
reversal strategies at the -1.0 VB levels, which was a good contra play to the
short index positions. In spite of the OIH (-0.9) and XLE (-0.7) closing
red, traders banked it on the long side. The 4 MA’s of the volume ratio,
55 and breadth +434, are not short-term oversold yet, and the SPX 5-RSI is still
55.76, so there is downside room. The new SPX highs were made with a
negative momentum divergence (5-RSI).
The $US dollar has been churning at the current lows (82.35-82.53) for
the past 5 days and has a positive 5-RSI divergence that was < 10, and closed
yesterday at 33.68, so there is likely to be an oversold bounce. The
14-RSI remains less than 30, at 29.02. If the $US dollar has the oversold bounce, it
will set up the next long entries in gold stocks/ETFs. The rally in $GOLD
(continuous contract) since early October ran from about 563 to 655 (+16.3%),
and above all of its 20-, 50-, and 200-dema’s. It has pulled back the last
4 days to the 20-dema (635.64), closing at 637. The initial retracement
zone is 632 (50-dema) and 620 (.382 retracement). The .618 retracement is
down at 598, which is also the 200-dema (598.98).
The SPX is back to minor support 1407.89 (previous high) and
will probably trade lower into next week, if the energy sector continues its
excellent rally off the October lows (see charts). After December 15, it
is all about the generals, not reality.
Have a good trading day,
Kevin Haggerty
Check out Kevin’s
strategies and more in the
1st Hour Reversals Module,
Sequence Trading Module,
Trading With The Generals 2004 and the
1-2-3 Trading Module.


