INTC In Focus, And Here’s Where The SMHs Could Get Interesting
What Monday’s Action Tells
You
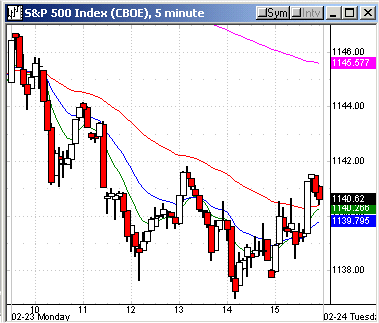
The SPX
(
$SPX.X |
Quote |
Chart |
News |
PowerRating) closed at
1140.99, -0.3%,
and the Dow
(
$INDU |
Quote |
Chart |
News |
PowerRating) 10,610, minus just 9 points. The
(
SPY |
Quote |
Chart |
News |
PowerRating)s have
been
churning for six days at the 116.50 level before declining to a 114.55 close
yesterday. 116.50 was the 2.0 STDV on the weekly chart and on the SPX, the
zone
was 1150 – 1161. (See 02/13/04 commentary for chart.) The Nasdaq hit its
initial
three-month trading range upper boundary support at 2000, which was the
intraday
low yesterday and closed at 2008, -1.5%, as much of the speculative junk
heads
south. The
(
QQQ |
Quote |
Chart |
News |
PowerRating)s closed at 36.45, -1.1%, right back to the early
February
lows and bouncing up into the close yesterday from the 36.15 double
bottom.
The QQQs and Nasdaq have been retracing for a
month now after hitting 2154 for the Nasdaq and 39 for the QQQs, both 01/26
highs. The Nasdaq has declined -7.1% high-to-low so far, and the QQQs -7.9%.
As they do both ways most of the time, the
(
SMH |
Quote |
Chart |
News |
PowerRating)s have led, hitting a 45.78 high on 01/13 and declining -12.7% so
far,
and -11.7% close-to-close, going out yesterday at 40.40, -2.8% on the day,
which
is a new low close and right at its 02/05 40.40 intraday low. The
SMHs, -2.8%,
and XBD, -1.4%, led the red sectors yesterday. What a difference a couple of
days make as
(
AMAT |
Quote |
Chart |
News |
PowerRating) from that +5.1% earnings jiggle has declined -12.7%
from the 24 high in just three days. The news groupies once again took it on
the
chin.
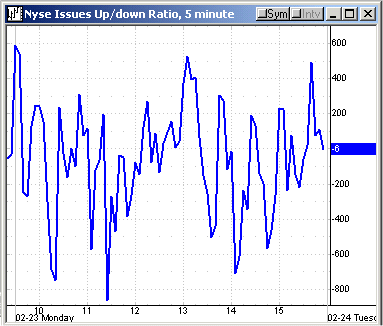
NYSE volume was only 1.38 billion yesterday, with
the volume ratio at 31, and breadth -911. However, it was a different story
for the QQQs and SMHs. The QQQs for the past two days have had their second
and third largest volume days since 06/06/03. The SMH also had a significant
increase in volume yesterday, trading 63% more than its average volume. On the
other hand, the SPY volume has declined the last two days, having traded 51.2
million on Thursday, 46.7 million on Friday, and just 36.2 million yesterday.
The
(
DIA |
Quote |
Chart |
News |
PowerRating)s have gone 6.4 million, 9.3 million and 7.3 million over the same
period.
| size=2> | Tuesday
2/17 |
Wednesday
2/18 |
Thursday
2/19 |
Friday
2/20 |
Monday
2/23 |
| color=#0000ff>Index | |||||
| color=#0000ff>SPX | |||||
| color=#0000ff>High | 1158.98 | 1157.40 | 1158.57 | 1149.81 | 1146.69 |
| color=#0000ff>Low | 1145.81 | 1149.42 | 1146.83 | 1139.00 | 1136.98 |
| color=#0000ff>Close | 1156.99 | 1151.82 | 1147.06 | 1144.10 | 1140.99 |
| color=#0000ff>% | +1.0 | -0.5 | -0.4 | -0.3 | -0.3 |
| color=#0000ff>Range | 13.2 | 8.0 | 11.7 | 10.8 | 9.7 |
| color=#0000ff>% Range | 85 | 30 | 2 | 47 | 41 |
| color=#0000ff>INDU | 10715 | 10672 | 10665 | 10619 | 10610 |
| color=#0000ff>% | +0.8 | -0.4 | -.07 | -0.4 | -.09 |
| color=#0000ff>Nasdaq | 2080 | 2076 | 2046 | 2038 | 2008 |
| color=#0000ff>% | +1.3 | -0.2 | -1.5 | -0.4 | -1.5 |
| color=#0000ff>QQQ | 37.45 | 37.53 | 36.98 | 36.87 | 36.45 |
| color=#0000ff>% | +1.4 | +0.2 | -1.5 | -0.3 | -1.1 |
| color=#0000ff>NYSE | |||||
| color=#0000ff>T. VOL | 1.35 | 1.37 | 1.52 | 1.47 | 1.38 |
| color=#0000ff>U. VOL | 1.06 | 453 | 557 | 387 | 431 |
| color=#0000ff>D. VOL | 285 | 906 | 919 | 1.05 | 937 |
| color=#0000ff>VR | 79 | 33 | 38 | 27 | 31 |
| color=#0000ff>4 MA | 65 | 47 | 45 | 44 | 32 |
| color=#0000ff>5 RSI | 66 | 57 | 49 | 44 | 39 |
| color=#0000ff>ADV | 2425 | 1289 | 1214 | 1168 | 1188 |
| color=#0000ff>DEC | 905 | 2003 | 2071 | 2117 | 2099 |
| color=#0000ff>A-D | +1520 | -714 | -857 | -949 | -911 |
| color=#0000ff>4 MA | +388 | -101 | -209 | -250 | -858 |
| color=#0000ff>SECTORS | |||||
| color=#0000ff>SMH | +1.6 | +0.5 | -1.9 | -0.8 | -2.8 |
| color=#0000ff>BKX | +0.6 | -0.6 | +.06 | -0.4 | +0.2 |
| color=#0000ff>XBD | +2.3 | -0.2 | -1.3 | -0.6 | -1.4 |
| color=#0000ff>RTH | +1.1 | -0.1 | +0.4 | +1.1 | -0.5 |
| color=#0000ff>CYC | +0.9 | -0.6 | +0.1 | -0.7 | -0.8 |
| color=#0000ff>PPH | +0.4 | -1.7 | +0.4 | -0.3 | -0.5 |
| color=#0000ff>OIH | +1.1 | -1.8 | -.08 | -.03 | -0.5 |
| color=#0000ff>BBH | +0.2 | +0.8 | -0.4 | -0.1 | -0.9 |
| color=#0000ff>TLT | -.07 | +.07 | +.01 | -0.8 | +0.5 |
| color=#0000ff>XAU | +3.0 | -4.6 | -0.2 | -2.7 | -1.0 |
^next^
For Active Traders
It was trend down right after the opening for
the
DIAs yesterday, until Friday’s 105.94 low was taken out, followed by an RST
buy
entry above 106.02, and then a second entry above 105.90 which advanced to
only
106.28 from 12:15 p.m. ET to 4:00 p.m., closing at 106.15. The daily chart
RST
sell entry in the DIAs was below 106.95 on Friday.
The SPY yesterday gave an RST buy entry above
114.40, which traded to just 114.71 and also re-crossed the 20-day EMA at
114.57. This trade was scratched at breakeven and a second entry taken above
114.35, but it only traded to 114.68 from 2:15 p.m. to 4:00 p.m., closing at
114.55. Those of you who have also switched from long index proxies to long
LEAP
calls and selling the near-month out-of-the-money options, took in another
month
of premium at the February expirations and have already sold March at much
higher strikes.
The semi trade that made sense to me
yesterday on
the long side was
(
INTC |
Quote |
Chart |
News |
PowerRating), which hit a 28.65 low vs. its 200-day EMA of
29
and the 28.48 40-week EMA with the 1.272 extension at 28.30. The trade was
taken
and held, closing at 29.19. INTC is -17.2% in 29 days and in a potential RST
zone, in addition to a Generals’ Pullback level. That didn’t preclude taking
the
good intraday setup yesterday at the 28.50 – 29 zone.
This key time zone and option expiration has,
in
fact, led to volatility and opportunity, with 02/23/04 being the key time
date.
(See 02/19/04 commentary.)
Today’s
Action
INTC is in a zone to focus on and at -17.2%
is
well ahead of the SMH, which is -12.7%. The SMHs get very interesting below
38.41 on an RST basis, with 38.44 and 38.28 also key levels, followed by
the
40-week EMA at 38 and the 200-day EMA at 37.63.
(
KLAC |
Quote |
Chart |
News |
PowerRating) is an individual
semi that closed at 53.69 vs. its 200-day EMA at 53.48, so that becomes an
intraday focus both ways around the line. No RST pattern can set up for KLAC
until the 52.74 12/10/03 low is taken out, and maybe a break of the 200-day
EMA
will get that job done sooner than later. The closing price is also at the
.236
retracement to the October 2002 low, with the .382 retracement just below at
48.
Any early rally in the SPY today will have
its
first test at 115 and the DIAs at 106.55. For the Nasdaq, it is 2035 and the
QQQs 36.80.
Several basic industry stocks were green
yesterday, like
(
AA |
Quote |
Chart |
News |
PowerRating),
(
CAT |
Quote |
Chart |
News |
PowerRating) and
(
DD |
Quote |
Chart |
News |
PowerRating), and the XLBs went out at
26.54.
The initial test and/or short level is 26.60.
The DIAs closed at 106.23, which is also its
20-day EMA, so that becomes an early pivot both ways. The SPY closed at
114.57,
right at its 20-day EMA, which is also 114.57, with the 50-day EMA down at
112.57. The 89-day EMA for the QQQs is at the 36 level, which also is the
top of
the 36 – 34 three-month box that the QQQs broke out of for the last run to
39.
There’s a lot going on, so you should have some good opportunity for the
rest of
this week.
Have a good trading day,
Kevin Haggerty
P.S. Join me for a FREE
45-minute conference call today on Sequence Trading. It’s at 4:15 EST. To listen in, you must reserve a space. Click
here to sign up. Or go to https://tradingmarkets.comconhagg.cfm.


