International ETF’s are Showing Weakness
The Nasdaq capped an impressive week
with another day of gains last Friday, its fifth straight higher close.
The Nasdaq Composite, small-cap Russell 2000, and S&P Midcap 400 indices each
rallied 0.7%, while the S&P 500 and Dow Jones Industrial Average gained 0.5% and
0.3% respectively. Despite the three-day holiday weekend, volatility was decent
and stocks trended steadily higher throughout the session before closing at
their intraday highs. The Nasdaq, which lagged in the latter half of last year,
is off to a solid start in 2007. Since the beginning of the month, the
tech-dominated index has already gained 3.6%, but the S&P 500 has advanced only
0.8%. Given that December marked the seventh consecutive month of gains
for the S&P, it’s not surprising that the index is taking a break so far in the
new year.
Turnover was lower across the board last Friday, but still
exceeded 50-day average levels. Total volume in the NYSE declined by 9%, while
volume in the Nasdaq was 10% lighter than the previous day’s level. In both
exchanges, advancing volume exceeded declining volume by a solid ratio of 2.2 to
1. Last week, the Nasdaq posted three consecutive days of higher volume gains (aka
“accumulation days”) that pointed to institutional buying activity. Conversely,
the index has registered only one bearish “distribution day” within the past
four weeks. The Nasdaq has been pretty healthy “under the hood,” but buying
pressure in the NYSE has been much more subdued.
In the latter half of last week, we pointed out several sector
ETFs that were showing both relative strength and bullish reversal patterns.
Going into this week, those same ETFs still look pretty good. Each of the
following closed last week above resistance of downtrend lines that had been in
place for approximately one year: Semiconductor HOLDR
(
SMH |
Quote |
Chart |
News |
PowerRating), Biotech HOLDR
(
BBH |
Quote |
Chart |
News |
PowerRating),
and Internet HOLDR
(
HHH |
Quote |
Chart |
News |
PowerRating). Not surprisingly, each one is a Nasdaq-related
sector. When a stock or ETF reverses and breaks out above a downtrend line, the
amount of bullish momentum is directly correlated to the length of the downtrend
that it broke out above. The longer the prior trend was in place, the stronger
the subsequent reversal tends to be. Therefore, if looking to buy new ETF
positions this week, these three ETFs are among your best bets. We are already
long SMH, and will be stalking both BBH and HHH for potential long entry points
in the coming days.
As for sectors with relative weakness and bearish chart
patterns, Utilities, Oil, and Gold are about the only ones. However, we would
not consider selling short these sectors right now because they are a bit
“oversold” in the short-term and could easily bounce over the next week before
resuming their new downtrends. But upon scanning of more than 300 ETFs of all
categories, we did notice one group that is indeed setting up nicely on the
short side. Many of the international ETFs, and emerging markets in particular,
have all begun to roll over.
Last year, the international ETFs in general were among the
highest percentage gainers in the U.S. stock market. As such, it’s not shocking
that many are now correcting from their awesome gains. From the start of the new
year through January 10, many international ETFs took a beating, then bounced
last Thursday and Friday. However, they will likely see another leg down over
the next week or two before finding any type of substantial support. At the very
least, they should at least re-test their January 10 lows. This means that the
current bounce may provide a near-term short selling opportunity in this group.
The iShares Emerging Market Index
(
EEM |
Quote |
Chart |
News |
PowerRating) and the iShares Xinhua China 25
(
FXI |
Quote |
Chart |
News |
PowerRating)
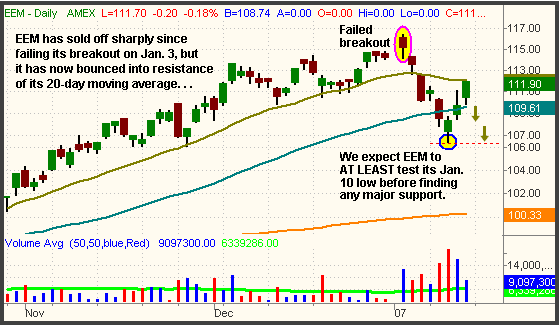
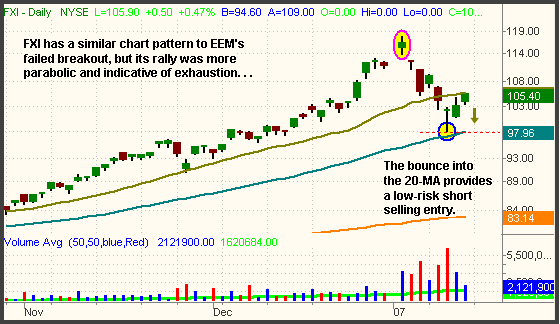
are two ETFs in particular that have intriguing chart patterns right now. Take a
look:


On January 3, both EEM and FXI gapped up to new record highs,
but their breakouts immediately failed the following day. The exhaustion of the
parabolic rally in FXI, and EEM to a lesser extent, led to a fast and furious
reversal in the days that followed. The steep selloff was also confirmed by
sharply higher volume that was indicative of institutional selling. Over the
last two days, both ETFs have bounced, but only into resistance of their 20-day
moving averages. Also notice how volume has declined on both of the “up” days.
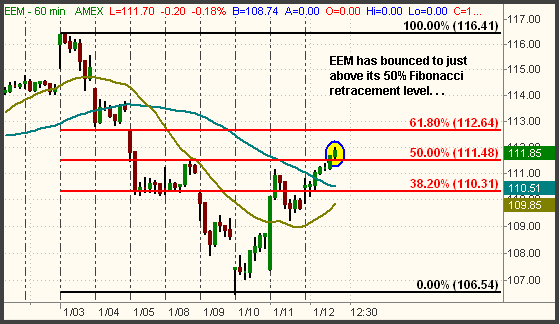
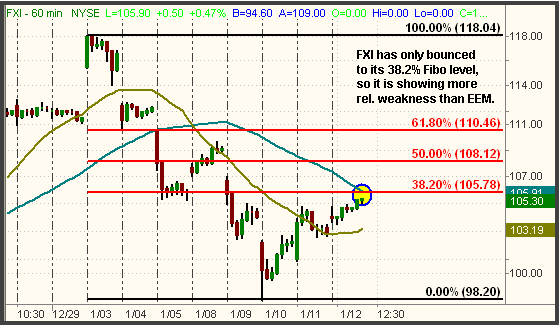
Finally, both EEM and FXI have bounced to
Fibonacci resistance levels as well. EEM has rallied to just above its 50%
Fibonacci retracement levels, while FXI is at its 38.2% retracement level. Both
ETFs are therefore at ideal entry points for short selling. The Fibo retracement
lines are illustrated on the shorter-term hourly charts below:


The Nasdaq Composite finished last week convincingly at a
fresh six-year high, but both the S&P and Dow closed right at resistance of
their December 2006 highs. Will the latter indices follow in the footsteps of
the Nasdaq by breaking out to new highs as well? The determining factor will be
the market’s reaction to the deluge of quarterly corporate earnings reports
scheduled to be released this week. We have learned from experience that
quarterly earnings season often has the nasty effect of causing stocks to ignore
their technical chart patterns. Be cognizant of the dates of corporate earnings
reports in the coming weeks because a negative earnings surprise by a leading
company this early in earnings season could have a rather negative impact on the
state of the broad market. It’s also worth reminding you that the actual
earnings numbers don’t matter. Rather, the only thing that matters is the
market’s reaction to the numbers. Among many others, Intel’s report card
is due out today. Apple’s numbers will be released tomorrow.
Open ETF positions:
Long SMH (regular subscribers to
The Wagner Daily
receive detailed stop and target prices on open positions and detailed setup
information on new ETF trade entry prices. Intraday e-mail alerts are also sent
as needed.)
Deron Wagner is the head trader
of Morpheus Capital Hedge Fund and founder of Morpheus Trading Group (morpheustrading.com),
which he launched in 2001. Wagner appears on his best-selling video, Sector
Trading Strategies (Marketplace Books, June 2002), and is co-author of both The
Long-Term Day Trader (Career Press, April 2000) and The After-Hours Trader
(McGraw Hill, August 2000). Past television appearances include CNBC, ABC, and
Yahoo! FinanceVision. He is also a frequent guest speaker at various trading and
financial conferences around the world. For a free trial to the full version of
The Wagner Daily or to learn about Deron’s other services, visit
morpheustrading.com or send an e-mail to
deron@morpheustrading.com .
