International ETFs you should be monitoring
Stocks posted their fourth
consecutive day of gains yesterday, enabling the Nasdaq Composite
(
COMP |
Quote |
Chart |
News |
PowerRating)
to close above its 200-day moving average for the first time in four months.
Both the S&P 500
(
SPX |
Quote |
Chart |
News |
PowerRating) and Dow Jones Industrial Average
(
DJX |
Quote |
Chart |
News |
PowerRating) gained
0.4%, while the Nasdaq advanced 0.5%. Small and mid-cap stocks showed the most
relative strength, a confirming indicator of the broad market’s newfound
strength. The Russell 2000 and S&P Midcap 400 indices each rallied 0.9%.
Total volume in the NYSE declined by 7%, while volume in the
Nasdaq was 6% lighter than the previous day’s level. Obviously, it is always
better when higher volume coincides with a session of broad-based gains, but
turnover remained healthy nevertheless. The NYSE volume level has exceeded its
50-day average in each of the past three sessions, certainly a welcome change
from the August doldrums. More importantly, solid gains in the S&P coincided
with each of those three days. Market internals remained strong as well.
Advancing volume in the NYSE exceeded declining volume by a margin of 2 to 1,
while the Nasdaq ratio was slightly better at 5 to 2. Institutional traders have
clearly been scooping up shares of stock over the past several days, despite a
weak start to the month of September.
The recent strength in the U.S. markets has generated buying
interest in a handful of the international markets as well. As such, now is a
good time to review the chart patterns of the plethora of international ETFs
found on the free
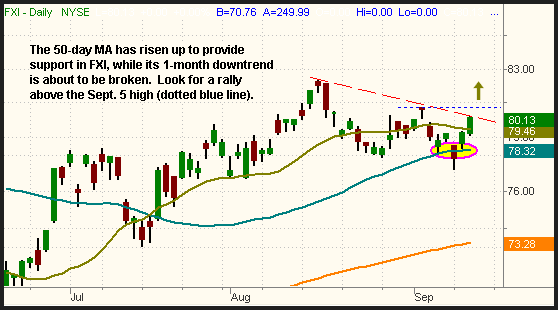
Morpheus ETF Roundup. The iShares Xinhua China 25 (FXI) is arguably the
international ETF with the most relative strength. This ETF, which tracks
mainland China’s equivalent of the Dow Jones Industrial Average, has been
oscillating in the $76 to $80 range for the past several months, but appears it
may soon break out. Looking at the chart below, notice how the 50-day moving
average has risen up to provide support at the $78 area. If FXI rallies above
its September 5 high, it will break the one-month downtrend. Beyond that, its
all-time high is not much further above:

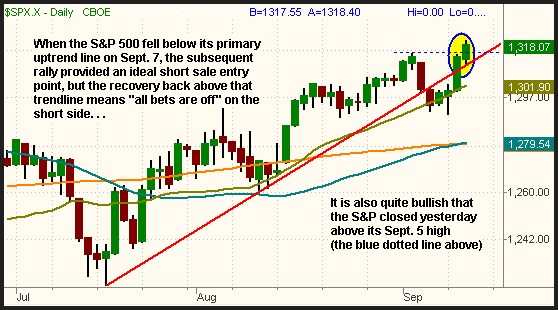
On September 7, the S&P 500, along with several other
broad-based indices, fell below support of their primary uptrend lines from the
lows of July. When that occurred, we suggested that market sentiment may be
changing and traders should consider initiating new short positions into
subsequent strength. However, recall we also explained that “all bets are off”
on the short side of the market if the S&P rallies back above new resistance of
its prior uptrend line. As you might have guessed, that is exactly what has
happened over the past few days. As you can see, the S&P 500 spent only three
days below resistance of its prior uptrend line before surging back above it:

Not only did the S&P rally back above its primary uptrend
line, but it also closed above its prior “swing high” from September 5. Both the
Nasdaq and Dow have similar bullish chart patterns. Because the major indices
recovered from last week’s weakness in such a convincing way, we feel that
overall odds no longer favor the short side of the market (at least in the
short-term). Further, the S&P 500 is now less than one percent below its 52-week
high, although the Nasdaq Composite is still well below its high.
As subscribers are aware, we initiated a new short position in
the iShares Russell 2000 (IWM) on September 12. In hindsight, the trade has not
been working out too well, but hindsight is always 20/20. At the time of entry,
we had several valid reasons for doing so. For starters, the S&P was rallying
into resistance of its prior uptrend line, which normally provides a very
positive risk/reward ratio for new short positions in general. More specific to
the IWM setup is that it was forming the right shoulder of a bearish “head and
shoulders” chart pattern and was doing so as it rallied into resistance
of its 200-day moving average. All these combined factors gave us logical cause
to assume the short sale in IWM would work in our favor. But, as we are
occasionally reminded, the market does not always work in a logical fashion.
That’s why we rely on protective stop loss orders with every single trade. Since
IWM has not yet hit our stop price, all we can do at this point is simply let
the trade work itself out in one direction or the other. We also bought the
StreetTRACKS Homebuilders (XHB) yesterday, and remain short the S&P Select
Energy SPDR (XLU). So far, the XLU trade is working well and showing a solid
unrealized gain.
Open ETF positions:
Long XHB, short XLU and IWM (regular subscribers to
The Wagner Daily
receive detailed stop and target prices on open positions and detailed setup
information on new ETF trade entry prices. Intraday e-mail alerts are also sent
as needed.)
Deron Wagner is the head trader of Morpheus Capital
Hedge Fund and founder of Morpheus Trading Group (morpheustrading.com),
which he launched in 2001. Wagner appears on his best-selling video, Sector
Trading Strategies (Marketplace Books, June 2002), and is co-author of both The
Long-Term Day Trader (Career Press, April 2000) and The After-Hours Trader
(McGraw Hill, August 2000). Past television appearances include CNBC, ABC, and
Yahoo! FinanceVision. He is also a frequent guest speaker at various trading and
financial conferences around the world. For a free trial to the full version of
The Wagner Daily or to learn about Deron’s other services, visit
morpheustrading.com or send an e-mail to
deron@morpheustrading.com .
