Intraday Trading High-Quality Stocks, Part 1
Trading “wiggles” intra-day is exactly what it sounds like. It’s sitting in front of a computer during the trading day and making a lot of trades for small gains, as a stock’s price exhibits it natural fluctuation, its “voice” if you will, against the framework of a bullish run. Clearly, this type trading is not for everyone. For me, it’s trading a $100,000 account in 500 to 1,000 share size of a $50 to $150 stock for 15 to 40 cent gains ($130 to $380 profit after commission for each 1,000 share trade).
Click here to learn exactly how you can maximize your returns with our new 2-Period RSI Stock Strategy Guidebook. Included are dozens of high-performing, fully quantified stocks strategy variations based around the 2-period RSI.
Ideally, one makes 10 to 20 of these in the course of a trading day to generate $1,300 to $7,600 profit or 1.3 to 7.6 percent daily return on the account. With 221 trading days a year, that’s a pretty good living on a $100,000 account. It’s also a useful strategy for trading less often for those so inclined, say just one day a week to augment longer-term strategies. My approach has been to find edges that improve my success rate, and that’s what I’ll talk about here.
Edge 1: Trade High Volume, Fundamentally Sound Companies
For me, only those stocks meeting a number of fundamental, earnings-related criteria, like a Zacks’ 1 or 2 ranking, membership in one or more of IBD’s daily screens, positive earnings revision fuel and a two-year PEG ratio less than 1.5, plus trade more than 1.5 million shares daily, qualify. The reason is the same one as to why I concentrate on these type-stocks over longer time frames: institutions buy them, and that buying pressure supports price at obvious support zones, like major moving averages, prior areas of price reversal, Fibonacci levels and intra-day the first hour’s high and low closes, to name a few. It’s nice to have a safety net.
Edge 2: Trade No More Than Five Stocks, but Know Them Well
Identify five or fewer, high-volume, TSM stocks to trade and get to know their daily trading patterns well: look for patterns that can be traded; understand how they trade around earnings and dividend reports, etc. For example, over the 61 trading days between 3/05/08 to 5/30/08, AGU made either its high or low of the day, in the first hour of trading, 85 percent of the time. Obviously, this first hour was important for AGU, as it is for many stocks.
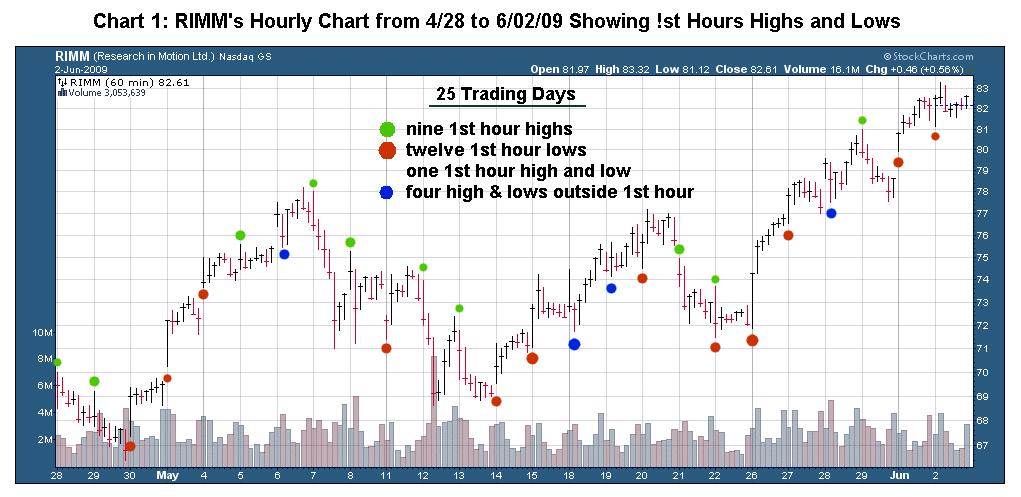
To trade this pattern, one first determines whether this first hour extreme is likely to produce the high or low of the day (possibly after gapping up or down). In the first case, I could sell my holdings and try to re-build the position during the day at a lower price. Â In the second, if I suspect it’s made a low for the day, I could buy the rebound and look to sell later in the day. Chart 1, a more recent chart depicting RIMM’s hourly pattern, also shows a first hour preference for making the highs and lows of the day: over the 25 trading days shown, 84 percent of the time RIMM made its high or low of the day in the first hour of trading. This pattern reinforces the idea that the first hour is a good time to look for opportunities in a day trade.
Edge 3: Inter-day Relationships Are Important
The relationship between today’s close and tomorrow’s high and low provides another potential edge. High-priced stocks often tend to trade intra-day over a wider range than they do between days. Too, there’s often a consistent pattern of highs that are at least $1 higher than the previous day’s close.
From 1/02/08 through 5/27/08 (100 trading days), there were 82 AGU highs that made at least a 25 cent gain over the prior day’s close; 77 at least 50 cents; 68 at least $1.00; and 59 at least $1.50. The average gain (today’s high minus yesterday’s close) was $1.94, and only nine were negative (five less than $1 below the prior close and the other four less than $1.50).
Using the same data set but this time looking at the high made today and yesterday versus the close the day before produces even better results.  There were 88 AGU highs that made at least a 25 cent gain over the first day’s close; 85 at least 50 cents; 79 at least $1.00; and 69 at least $1.50. The average gain (today’s high minus the close one or two day’s ago) was $2.90, and only five of those were losers (each losing less than $1.50). Do you think that a strategy that bought today’s close and sold for a dollar gain oven the next two days would have been profitable, especially in a bullish market? I do too. It pays to develop these kinds of relationships for the stocks that you’re trading intra-day. It’s easily done in an Excel spreadsheet.
Edge 4: Identify Intra-Day Areas of Support and Resistance
In addition to major areas of past price reversal (former peaks and valleys occurring minutes, hours, days, weeks, months and even years earlier) that provide expected areas of support and resistance, there are three other important intra-days that you should be aware of: the prior day’s close, first hour’s high and low closes, and various intra-day Fibonacci levels. One can use these potential areas of support and resistance to anticipate what price is likely to do when it draws near one of them.
Edge 5: Intra-Day Setups  That Indicate a Market is Extremely Oversold
Figure 1: Minimum in the Commodity Channel Index (CCI)
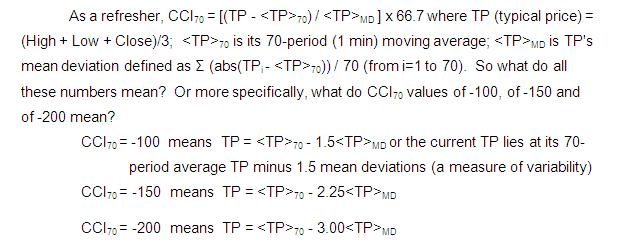
Suffice it to say that these measures are statistically relevant. As CCI(70) grows more negative or the current TP becomes increasingly less than its average value, the market’s degree of being oversold increases. It’s like a stretched rubber band that gets increasingly resistant to being extended further. Instead, it’s far more likely to snap back. CCI is an excellent indicator of when a market is abnormally stretched to its downside (or upside). Note, I use the 70-period CCI here for illustration, but on a 2-minute chart it would be a 35-period CCI and on a 5-minute chart a 14-period CCI.
The 2-Period Relative Strength Index (RSI) Similarly is a Measure of the Degree of Being Oversold
The relative strength index (RSI) is another measure of the degree price is oversold. Larry Connors of TradingMarkets.com has shown that the 2-period RSI used for either trading the S&P or forecasting its short-term movement is much more predictive of future price action than the more conventional 14-period RSI. Let me show you what it means. If both the last two closes were up closes, RSI2 = 100; if both were down closes, RSI2 = 100; but if one was an up close (uc) and the other a down close (dc), then RSI2 = 100 {uc/(dc+uc)} or RSI2 is the percentage of up close. Note, both uc and dc are positive (absolute) values.
Putting It All Together in Two Intra-Day Trades
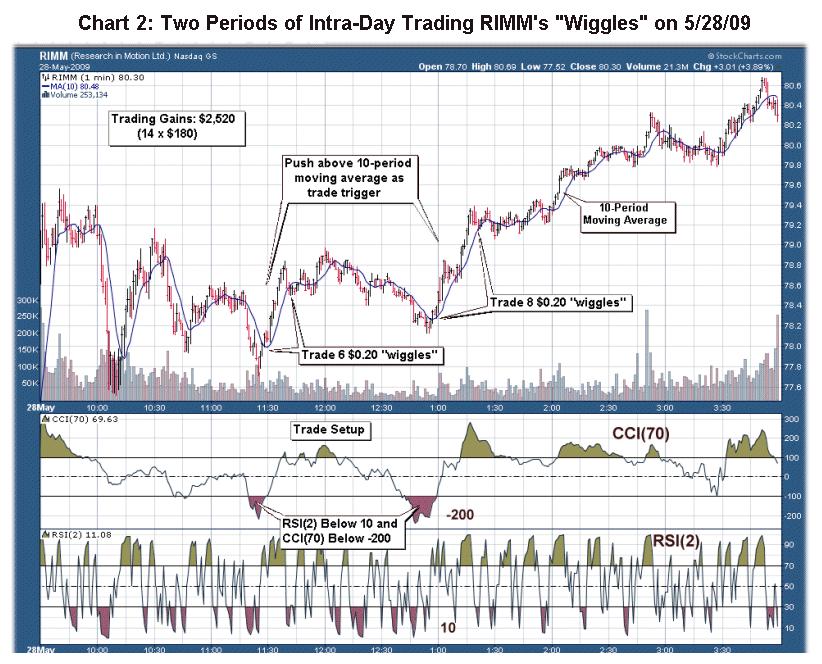
On a 1-minute chart, both CCI(70) and RSI(2) provide independent measures of the degree to which a position is oversold. Our trade setup requires CCI(70) to fall below -150 and RSI(2) to fall below 10, and limiting our trading to fundamentally sound stocks increases the probability for a predictable rebound following an intra-day pullback.
Chart 2, the 1-minute chart for RIMM shows how CCI(70) and RSI(2) met our setup criteria at two points during the day. Once price closed above its 10-period moving average (the “trigger”) trades were made to capture as many 20 cent gains as possible before price closed twice back below the 10-period MA. Â Notice, the low of the day was made in the first hour of trading, and the first trade was made as price pulled back near that low before rebounding. Fourteen successful trades, each of a 1,000 shares, followed two intra-day setups and triggers; they produced a $2,520 gain for the day.
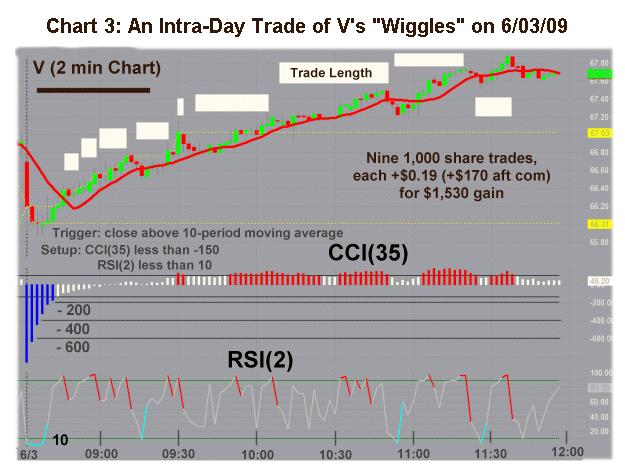
Finally, Chart 3, a two-minute chart, shows an excellent series of nine trades for V after extreme CCI(35) and RSI(2) setup conditions were met, again at the first hour’s low, followed shortly thereafter, by the 10-period MA trigger, and the trade was on. Â The white boxes track the duration of each trade, where each wiggle’s profit was INITIAL_CONTENT.19 per share. On 1,000 shares traded, the total gain amounted to $1,530 over the three- and-a-half hour period.
You’re probably asking yourself the following: Why not just enter at $66.40, ride it to the top and exit at $67.80 for a +$1.40 trade in one transaction. There are two answers: (1) there’s less risk in taking smaller bites and (2), as here, you can capture more profit in the sum total of those smaller bites. More often than not, these bullish runs are shorter term, like that of RIMM’s.
Obviously, putting as many edges on your side as possible will help your intra-day trading. Others, not discussed here, but worth looking at, are the average range for the 1, 2 and 5 minute bars, the average daily range, and the intra-day and inter-day average volatility, to name a few. In any event, trading “wiggles” can be profitable, even if you only do it occasionally (who wants to sit in front of a computer all day every day). In my next article, I’ll discuss a profitable strategy to use when the intra-day trade goes bad quickly, and you don’t want to take a big loss.
Richard Miller, Ph.D. – Statistics Professional, is the president of TripleScreenMethod.com and PensacolaProcessOptimizaton.com .


