Is PCR about the head south?
In today’s Chart of the Day, we’re going to look at a
quantified way of finding
Pullbacks From Lows.
Most successful momentum-based traders and money managers like to sell weak
stocks after they pull back. TradingMarkets.com uses a proprietary mathematical
model to identify up to 20 (in strong or choppy markets there will be fewer)
weak stocks that have pulled back from recent lows. These stocks should be
considered potential candidates to resume their longer-term downtrends. To learn
more about how to trade pullbacks successfully,
click here.
Perini
(
PCR |
Quote |
Chart |
News |
PowerRating)

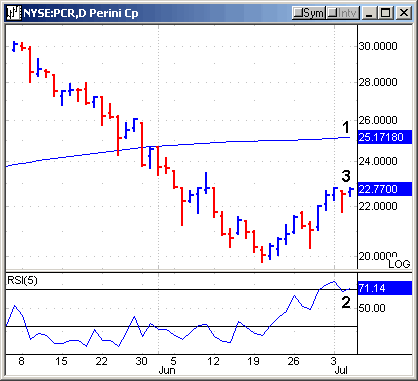
PCR was on the list of 20 stocks for 07/06/06. On top of that,
a number of other technical criteria are lining up to suggest a further decline
is possible.
1. PCR is trading below its 200-day
moving average,
which is often used as the dividing line between stocks in an uptrend and those
in a downtrend.
2. The 5-day RSI has reached overbought territory.
3. PCR has a PowerRating of 3, which suggests it is likely to underperform the
S&P 500 over the next five days.
In this chart, we’ve given you an example of what to look for
in Pullbacks From Lows. Remember trading short selling carries
a high degree of risk, so before you enter a position always have a plan that
includes a stop-loss. Risk control is essential when trading; never buy/sell
without a plan to sell/buy, hopefully for a profit but also possibly for a loss.
In the days to come we’ll show you more of these examples on both the long and
short side. I’ve enjoyed showing you this Chart of the Day, please feel free to
email me at editor@tradingmarkets.com
if you have any questions or comments.
Ashton Dorkins
Editor-in-Chief
