Is the S&P 100 ready to turn lower?
Charles Sachs has utilized S&P 100 for the past 14 years, both as a trader and an advisor. He uses 24 proprietary indicators in order to structure options strategies which can generate gains whether the market moves up, down or sideways.
Financial markets traded higher Thursday with the S&P 100
(
XEO |
Quote |
Chart |
News |
PowerRating) index up 5.66 points to the 580.22 level.
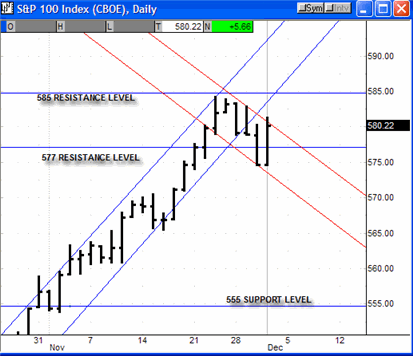
In the chart below, we see that yesterday’s rise in financial markets reversed Wednesday decline. Nevertheless, it remains unclear whether financial markets will now move back into their previous rising channel or if a reversal of trend is imminent.
I have drawn in red channel lines in the chart below that would correspond to a new downtrend for stocks. Today’s price action in financial markets will be informative of what will happen to financial markets going forward.

Bottom Line:
After 5 weeks of rising stock prices, financial markets have traded lower this week. Going forward, it is unclear whether financial markets will resume the uptrend as set forth in the blue channel lines of the chart above, or follow through on the downtrend as drawn by the red channel lines above.
In addition to the downward price action of stocks this week, there is long-term resistance (selling pressure) on the S&P 100 index at the 585 level.
In sum, traders should consider taking profits on long positions between the 577-585 levels on the S&P 100 index, and aggressive traders should consider undertaking short positions at the 585 level.
Sincerely, Charles Sachs Chief Options Strategist
