Is the VIX telling the whole story?
Suppose I described this market action to you. Where would you expect to see the VIX? Maybe 30, maybe 40, maybe on the way to 50. But a 15 handle? Just seems too low.
On a short-term basis, the VIX actually flashed an overbought signal for the market yesterday, as it drifted 10% below its 10-Day Simple Moving Average. That was after one good afternoon, so we’re really at oddly complacent levels here, given the scary market backdrop.
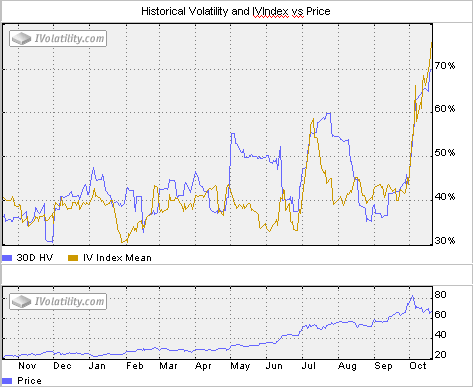
But when you take a look under the hood, there’s some real Fear remains out there, particularly in the Energy Patch. Here’s a volatility chart of
(
SWN |
Quote |
Chart |
News |
PowerRating), courtesy of ivolatility.com

Historical Volatility and IVIndex vs Price
Now all the options have done is keep pace with the stock volatility itself (blue line), but that’s a sign of increased fear in and of itself.
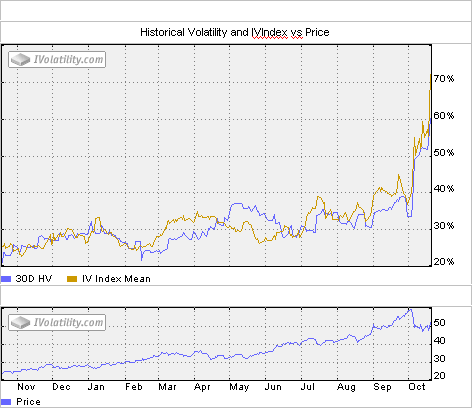
Encana
(
ECA |
Quote |
Chart |
News |
PowerRating) shows a similar pattern here.

Historical Volatility and IVIndex vs Price
I could pull out many more, but you get the drift.
So while Big Tech, and big cap names in general trade with no worries whatsoever (at least in the option measures), there’s some real concerns brewing below, particularly in sectors that acted well earlier in the year.
Not sure if I would classify this as bullish, but I would say that the volatility picture as told by the VIX/VXO/VXN tell an incomplete story.
Adam Warner
Adam Warner is a proprietary trader for Addormar Co., Inc., specializing in option and derivative strategies. Prior to Addormar, he was an Equity Options Market Maker on the floor of the American Stock Exchange from 1988-2001.
