Is this a real upside reversal? You’ll know by this chart…
The major averages came up for air
yesterday, breaking a three day losing streak
and all closing higher than Wednesday’s close. The Dow
(
DJX |
Quote |
Chart |
News |
PowerRating) gained by .42%,
closing at 10422.05, the S&P added .37%, closing at 1214.62, and the Nasdaq
Composite
(
COMP |
Quote |
Chart |
News |
PowerRating)Â ticked higher by .20%, posting 2110.78 as its
closing value at 4pm yesterday. For the first time in four days market
breadth–as measured by advancing volume minus declining volume–closed
positively. Overall volume, while respectably high, did not however come in
higher than the day before, and therefore the market did not log an
accumulation day yesterday.
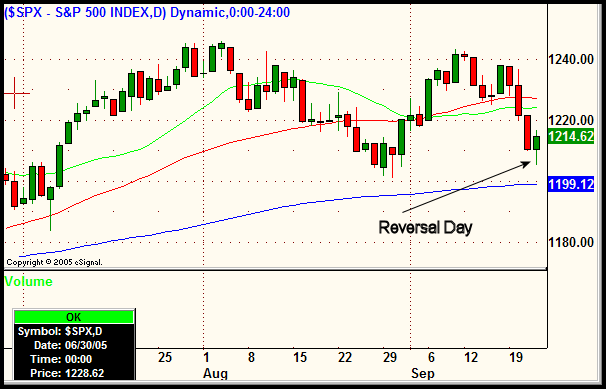
If there was any way to characterize Thursday’s trade, it
would have to be of the classic “reversal day” variety. As we know, markets very
rarely make what is known as a “V-shaped” reversal after protracted selling.
Usually between a change in trend is the reversal day which is defined by a
small body candle (sometimes doji) on the dailies and a mix of strong and weak
sectors fighting it out as the market finds its legs and decides if this is
indeed “the bottom” at least for the time being. That was exactly the
type of market we had yesterday, as the S&P closed relatively close to its open
and sector action was mixed with a number of sectors notching gains on the day
and seemingly as many turning in further losses. The daily chart below of the
S&P shows the small body daily bar that comprised yesterday’s action.

One of the stronger groups on the day was the homebuilders
sector ($DJUSHB). Although the group was relatively strong yesterday on the
heels of better than expected earnings from
(
KBH |
Quote |
Chart |
News |
PowerRating), the volume patterns in
the stocks clearly show just how weak the sector is and just how important it is
to pay attention to volume as well as price when making investment
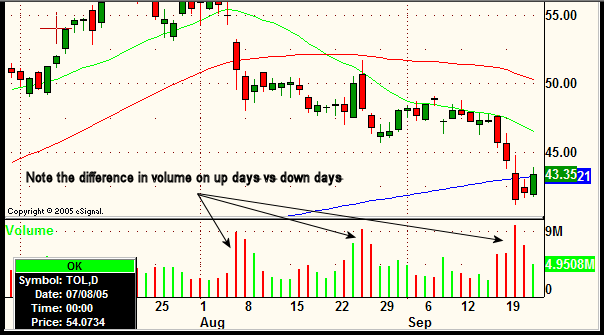
decisions. Note the difference in volume on Toll Brothers
(
TOL |
Quote |
Chart |
News |
PowerRating) in the chart
below over the last four days. Its a clear indication that sellers are in
control here as these stocks move lower. Most homebuilders charts are starting
to exhibit this same volume pattern which would confirm the recent change in
trend in this popular sector. This is the classic setup that you want to see
whenever shorting a stock or sector. Quite simply, more volume on the down days,
and less on the up days. This confirms that you have an imbalance of sellers to
buyers which will always lead to lower prices down the line.

Obviously the question on everyone’s mind after a selloff is
quite simply, “when do we go up again?” and “how far?”. As professional traders
who simply place bets on events that have the greater odds (but not certainty)
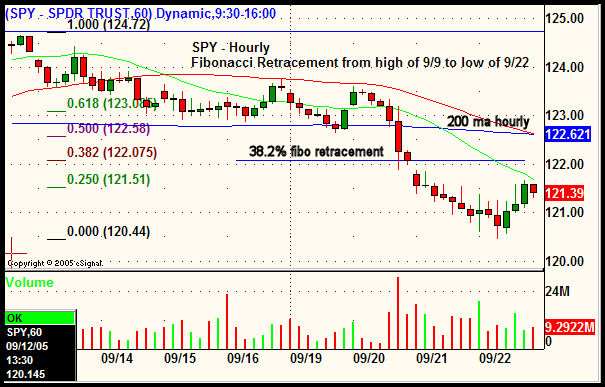
of happening, we cannot really know for sure. One of the tools that we know
works historically is Fibonacci retracement. Keeping in mind the general
rule of thumb that if a retracement of a move is 38.2% or less (the first
Fibonacci level), the recent trend is still intact, take a look at the hourly
SPY chart below to give yourself an idea of where the S&P needs to bounce to if
it is to invalidate the recent bear move. As you can see below, yesterday’s
reversal day did not even get up to the first Fibonacci retracement from the
weakness that started on September 9th. Fibonacci levels are often an excellent
gauge to determine the difference between technical bounces and outright changes
in trend.

Open ETF positions:
Long GLD and Short IYR (regular subscribers to
The Wagner Daily receive detailed stop and target prices on open
positions and detailed setup information on new ETF trade entry prices. Intraday
e-mail alerts are also sent as needed.)
Deron Wagner is the head trader of Morpheus Capital
Hedge Fund and founder of Morpheus Trading Group (morpheustrading.com),
which he launched in 2001. Wagner appears on his best-selling video, Sector
Trading Strategies (Marketplace Books, June 2002), and is co-author of both The
Long-Term Day Trader (Career Press, April 2000) and The After-Hours Trader
(McGraw Hill, August 2000). Past television appearances include CNBC, ABC, and
Yahoo! FinanceVision. He is also a frequent guest speaker at various trading and
financial conferences around the world. For a free trial to the full version of
The Wagner Daily or to learn about Deron’s other services, visit
morpheustrading.com or send an e-mail
to
deron@morpheustrading.com .
