Is this more than a bounce? Here’s what I see
After a selloff that started on
October 3rd, and didn’t abate for nine straight sessions,
the major averages finally caught a bid on Friday and managed to close above
their opens and tack on some gains. The Dow Jones Industrial Average gained
70.75 (+.69%), The S&P 500
(
SOX |
Quote |
Chart |
News |
PowerRating) added 9.73 points (+.83), and the Nasdaq
Composite
(
COMP |
Quote |
Chart |
News |
PowerRating) was ahead by 17.61 (+.86%). After an announcement that
Steven Spielberg would collaborate with Electronic Arts
(
ERTS |
Quote |
Chart |
News |
PowerRating) on three new
games, the software sector
(
GSO |
Quote |
Chart |
News |
PowerRating) up 1.96%) seemed to be the catalyst that
got the Nasdaq moving, which was complemented by some interest in energy sectors
such as Oil Services
(
OSX |
Quote |
Chart |
News |
PowerRating) up 2.54%) and Natural Gas
(
XNG |
Quote |
Chart |
News |
PowerRating) up 2.05%)
that got the S&P and Dow moving northward into the close after a choppy open.
Whenever the market has a prolonged move in one direction and
then turns in a reversal day like Friday, there is always speculation as to
whether the reversal day in question is a technical event that has fully
reversed the trend, or is it just a "bounce" or "reaction" in the context of the
already established trend. The answer to this question does not often lie in
just one place, but is a combination of factors that will help us to decide what
effect, if any, moves in the market have on overall bias. There are two main
factors that are necessary for a market to define and sustain a trend. The first
is that there be parallel moves in overall volume with the market (increases in
overall volume as the market moves in the direction of the trend), and the
second is that all sectors are firing on all cylinders and moving together in
the direction of the trend. If an advance is to be meaningful it should have
across the board participation from an overwhelming majority of sectors.
Lets analyze yesterday’s market action from these two perspectives.
In Friday’s publication we noted that overall volume in the
Nasdaq did not increase, even as the Nasdaq turned in a stronger performance
than the Dow and S&P and was ahead by almost 10 points. This has been more of a
rule than exception lately in the markets as we turn in distribution day after
distribution day. Friday’s trade was no exception as all of the major averages
were in the green at the closing bell but overall volume fell by 7% in the NYSE
and 16% on the Nasdaq. The two graphics below illustrate the unhealthy inverse
relationship between price action and overall volume on the two exchanges.
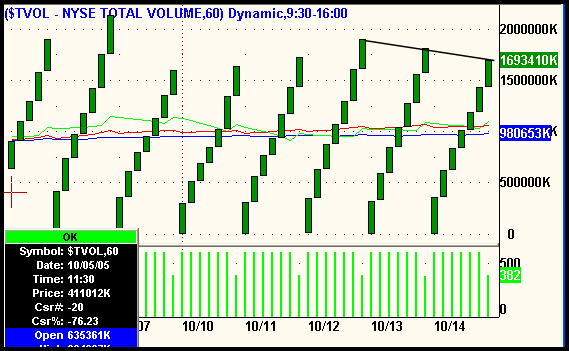

In the graphical representations above, overall volume on both exchanges came in
noticeably lower on Friday even as the market staged a respectable advance.
Notice as well how strong overall volume was in preceding days as the market
sold off very hard. This tells us that the "bounce" failed the first test of
being an all out reversal. The market moved upwards and overall volume did not
confirm.
As stated above, the second factor in analyzing reversal
versus bounce in context of trend is to discern whether or not the advance of
the reversal was broad based or scattered among a few sectors. One of the
characteristics of Friday’s rally that struck us as odd was the lack of
participation in the Semiconductor Index, or
(
SOX |
Quote |
Chart |
News |
PowerRating). Long time readers of
The Wagner Daily know that the chip stocks have so much weight in the Nasdaq,
that it will be difficult for the Nasdaq to stage an advance without their
participation. Furthermore, this could be a sign that the Nasdaq which was
relatively strong to the Dow in preceding months is now also succumbing to
selling pressure. Although the Nasdaq Composite gained .86% on Friday,
the $SOX was actually down by .91%! Using a sector overlay is an
excellent way to quickly analyze how sectors are acting intraday when compared
against other sectors.

The snapshot above is simply a mix of 15 key sectors each represented by a line
chart that is plotting every five minutes throughout the trading day. Draw your
attention to the orange line which represents the $SOX or Semiconductor Index.
Oftentimes it takes a picture rather than words to clearly see positive and
negative divergence between sectors on an intraday basis. The negative
divergence between the orange line and the other sectors is very obvious as
almost every single other sector in the list closed above the zero line and most
turned up sharply at the close. So, therefore Friday’s advance also fails the
second test and for now should be defined as simply a "bounce" in the context of
the downtrend that began on October 3rd. Although slightly unrelated to the
topic at hand, don’t leave the chart above without noting that the brown line at
the bottom of the snapshot represents the $DJUSHB or Homebuilders Index. Its
just another confirmation of past commentary in this publication that has been
categorically bearish on the building sector.
Open ETF positions:
None. (regular subscribers to
The Wagner Daily receive detailed stop and target prices on open
positions and detailed setup information on new ETF trade entry prices. Intraday
e-mail alerts are also sent as needed.)
Deron Wagner is the head trader of Morpheus Capital Hedge Fund and founder of
Morpheus Trading Group (morpheustrading.com),
which he launched in 2001. Wagner appears on his best-selling video, Sector
Trading Strategies (Marketplace Books, June 2002), and is co-author of both The
Long-Term Day Trader (Career Press, April 2000) and The After-Hours Trader
(McGraw Hill, August 2000). Past television appearances include CNBC, ABC, and
Yahoo! FinanceVision. He is also a frequent guest speaker at various trading and
financial conferences around the world. For a free trial to the full version of
The Wagner Daily or to learn about Deron’s other services, visit
morpheustrading.com or send an e-mail
to
deron@morpheustrading.com .