It is All About the Symmetry
From 1990 to 1997, Kevin Haggerty served as Senior Vice President for Equity Trading at Fidelity Capital Markets, Boston, a division of Fidelity Investments. He was responsible for all U.S. institutional Listed, OTC and Option trading in addition to all major Exchange Floor Executions. For a free trial to Kevin’s Daily Trading Report, please click here.
The SPX declined to 888.86 last Tuesday (6/23) versus the 888 .236 RT to 666.79 from 956.23, and then the Generals stepped in for the QTR ending mark-up, and took the SPX up to 928 on Monday, and closed the QTR yesterday at 919.33. This was a +15.2% gain for the QTR, and made the SPX positive YTD at +1.8%. It was a job well done Generals, and all of us traders that capitalized on the manipulation are thanking you.
At the beginning of a new QTR, traders should assume nothing, and expect anything, especially in front of the long Holiday weekend. However, from a position standpoint the SPX is now very vulnerable to a correction below 888.86, especially on a pullback to the 940 200DEMA, through the 963 12 month SMA, and 973 12 month EMA. The SPX and other major indexes all had negative MACD divergences when they made the new rally highs, as did key ETF’s like the OIH, XLE, and XLB. A break below 888, assuming that 956 remains the Wave 1 high for the SPX, will probably decline to at least the 846 zone, with a good probability to hit the .50-.618RT zones from 812-777 before another leg up. The strongest resistance zone on continued strength is 940-973.
To change the subject for all of you day traders, I will give you a quick look into a day in the “Trading Service”, and show you that “it is all about the symmetry stupid”. I have included charts from yesterdays defined strategy trades in the SPX, and XLB, which highlights how the combination of a key strategy with significant symmetry gives you a much higher probability trade.
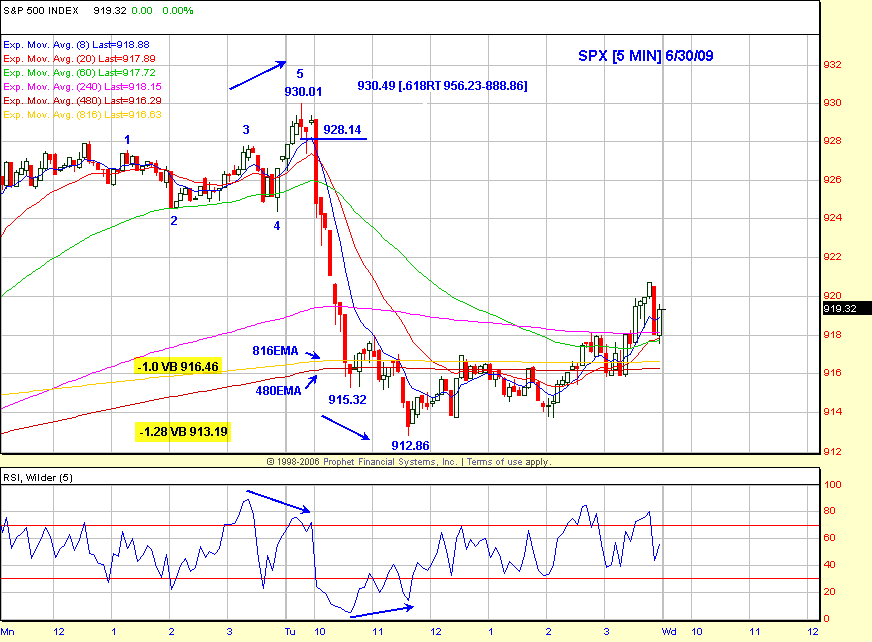
The SPX hit 930.01 on the 9:45 AM bar, which set up the high probability RST strategy with entry below 928.14. This strategy is available to service members, and those traders that have my specific trading modules which include the RST. The symmetry was the 930.49 .618RT to 956.23 from 888.86, and there was also a negative 5 RSI momentum divergence. The decision to take the trade is based on the SPX cash index, and it doesn’t matter whether you use the futures or index proxies. The initial exit decision was after the sharp 8 bar decline hit 915.32 at the 816/480 EMA’s, and also the -1.0 VB 916.46. The next exit symmetry was the -1.28 VB at 913.19 and 912.86 low. Regardless of which exit you took, it was a good day at the office Bud.

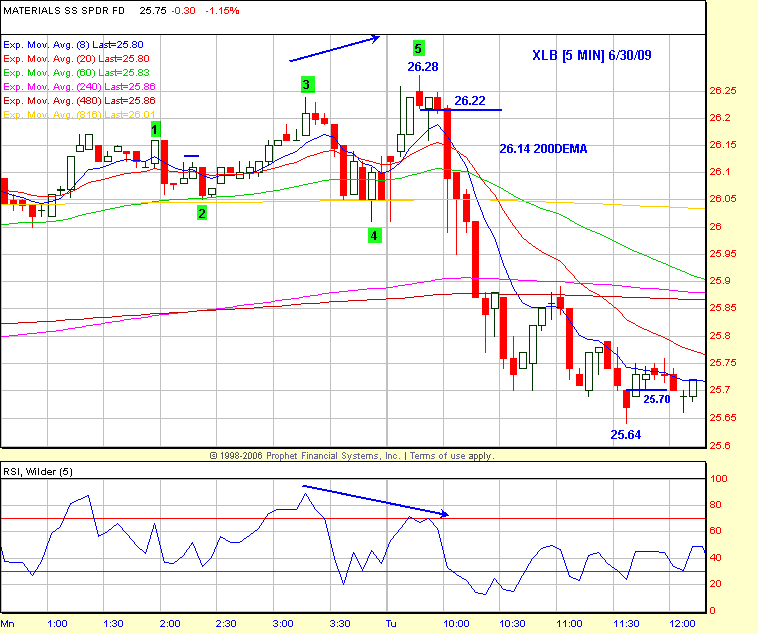
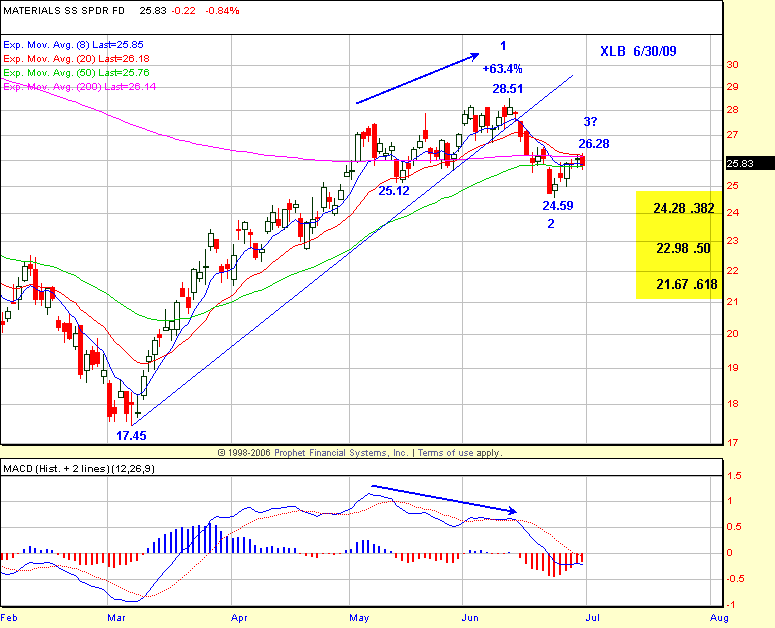
The XLB was the same RST strategy, with a negative 5RSI divergence, and the symmetry was a 5 bar pullback to the 26.14 200DEMA from the 24.59 low. This specific trade was exited above 25.70 The XLB daily chart outlines the same MACD negative divergence as the SPX, and in this case, as with the SPX, a 123 lower top is setting up, and the highest probability is that 24.59 will get taken out, especially after the +63.4% gain from the 3/6/09 17.45 low. The $US dollar has been trading in a narrow range the last two weeks, but a bounce up to the 83-84 key resistance ($USD) will put more downside pressure on the commodity sectors, and therefore the SPX.


Have a good trading day!
Click here to find full details on Kevin’s courses including Trading with the Generals with over 20 hours of professional market strategies. And for a free trial to Kevin’s daily trading service, click here.
