It’s Critical That You Understand This Process
Global
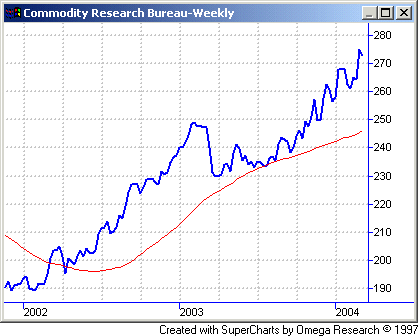
reflation has been massive and has peaked over the last few months. Global
reflation HAS successfully created a global recovery
and has prevented the adjustments required by the massive equity bubble of the
late 90s from developing. Yet the recovery produced by reflation is completely
unbalanced. Pockets of deflation linger in parts of Europe, while Asia’s
economies boom and are starting to produce inflation. Great
Britain, New Zealand, and Australia are
raising rates, while Europe still needs
to lower them.
Canada
is an interesting case. Its currency exploded as a commodity currency similar
to the NZD and AUD. And Canada started tightening rates just as New Zealand
and Australia did. But its currency rose too fast and when its economy
started showing declining exports and symptoms of a strong currency, Canada
actually re-cut interest rates. The result has been a strong correction
in its currency strength, and higher growth should re-emerge in Canada soon. In
essence, Canada was the first major economy that was FORCED
to reflate more aggressively by the currency markets. We suspect
Canada’s story will spread to many other countries by the end of this year. Europe
is the softest region of the world economically and we suspect after footdragging,
the ECB will cut rates eventually to offset the effects of its stronger currency.
If and when this happens, investors should recognize that US, Asian, and Japanese
massive reflation is spreading like a disease.
What Canada’s actions show is that financial
markets are acting as a transmission mechanism for rebalancing the gains from
reflation globally such that markets and economies are set up to converge more
closely. This is leading to unusually violent rotations in global asset
markets this year. It will be critical for investors to understand this convergence
process in order to play the mini-cycles of sector-and-country rotation in leadership
that is developing.
This is why last year’s laggards are the
current leaders in market performance. Laggards like Malaysia,
Taiwan, Russia, Norway, Portugal, Spain, Columbia, and Japan
head our list of top prospects according to our models, while last year’s winners
of India, Thailand, and China
are correcting. But we have not seen such a swift shift in relative strength
in a bull market so young ever before. Convergence is also taking place
on a sector basis. Last year technology, materials, gold, and industrials led
the bull market. So far this year more defensive sector like energy, utilities,
healthcare, telecom, and consumer staples are leading the way.
Upon the first evidence of Europe caving
in to easing pressure, European bond prices should outpace US, UK, and Australian
bonds — though it is unclear whether global bond prices in general can rise
or whether they will remain relatively flat with rotations until inflationary
pressures and employment gains begin to push rates higher.
Another powerful theme of the
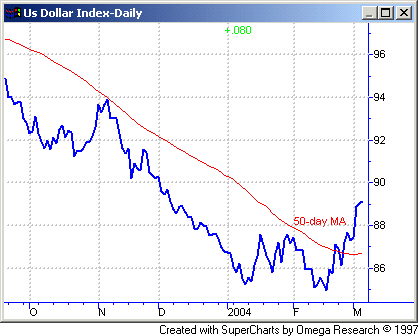
convergence rotation is a dollar correction. The
DXY dollar index has double-bottomed off of the 84.50 level and is hitting 88.2
resistance. If the dollar can break through the 88.50 level on news of
either better employment gains in the US, or ECB potential rate cut news or
talk, then an intermediate term dollar low will likely have been made and a
10% or so correction in the dollar will develop (euro 1.10, AUD and CAD in low
70s and yen at 110). If there is an absence of ECB rate-cut talk and the
employment gains in the US are slower to materialize, it is still possible that
a new low in the dollar will develop before this intermediate correction is
upon us. But sentiment is way overdone on the dollar and the trend is overdone
and due for correction. The over-adjustment of the dollar vs. the CAD,
AUD, and euro is one of the mechanisms by which convergence is developing. A
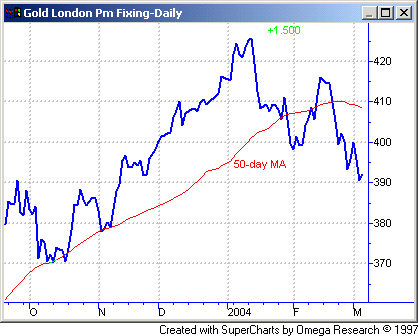
dollar correction likely means a further correction in gold down to the 370-390
support zone as well. Base metals prices are also hitting historic resistance
zones as well as witnessing massive overbullish sentiment, which should lead
to a correction.
Investors
should realize that many sectors and countries are now breaking out and likely
are leading a new leg higher in global equity markets. Despite large overvaluation
in most global equities, few of the classic warning signs of a major market
top have yet developed technically in the global equity markets. Valuation
seems to be a prime reason for market rotations as well.
The world is in the grip of a transition
from massive fiscal policy and monetary policy reflation to actual growth. While
growth has peaked, it has been uneven and markets are rebalancing the reflationary
impact to produce more synchronous global growth, albeit at slightly lower rates. Yet
very quickly following the realization that growth is solid and self-sustaining,
a new transition from growth to inflation will develop. Inflation will
follow much more quickly on the heels of growth than ever before because of
the unprecedented scale of reflation that has produced this growth cycle. It
will be interesting to see whether global equity markets can hold on to bullish
cycles until real interest rates become high, or if they begin to decline as
soon as it is clear that interest rates are heading up in earnest. The
amount of leverage and dependence upon artificially low interest rates around
the globe will become evident if a premature reaction by global markets in response
to higher rates develops. A rise by 10-year Treasuries above 4.5% should
be a clear warning sign to investors that the interest rate backdrop is starting
to turn negative (it is not clear whether this will develop in 2004 or 2005
yet).
The bottom-line is that investors will need
to be very attentive and flexible to achieve decent gains with reasonable risk
in 2004, as it looks as though it might be a volatile year.
So far our US long/short
model is fully on the sidelines and we continue to suggest investors position
in our favorite sectors noted above and use some caution until stocks meeting
our criteria expand in breakout breadth. Investors should continue to cautiously
add stock exposure as trade signals are generated that meet our strict criteria,
as well as allocate to our favorite segments. Our model portfolio followed
in TradingMarkets.com with specific entry/exit/ops levels from 1999 through
May of 2003 was up 41% in 1999, 82% in 2000, 16.5% in 2001, 7.58% in 2002, and
we stopped specific recommendations up around 5% in May 2003 (strict following
of our US only methodologies should have had portfolios up 17% for the year
2003) — all on worst drawdown of under 7%. This did not include our
foreign stock recommendations that had spectacular performance in 2003.
This week in our Top
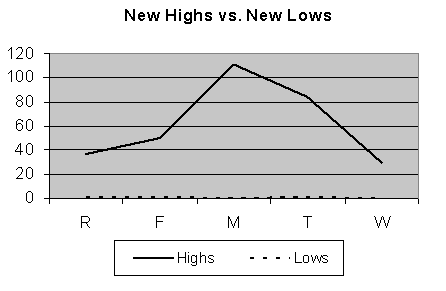
RS/EPS New Highs list published on TradingMarkets.com, we had readings of
37, 50, 111, 84, and 30, with 30 breakouts of 4+ week ranges, no valid trades
and close calls in OMM and PWN, a substantial improvement over last week and
an entire week with readings above 20. Let’s see if a good employment
report tomorrow can provide the impetus to a broader leg up re-emerging in global
equities. A trading range environment is likely until we get stronger internal
breadth numbers and higher quality and quantity of breakouts. Position
in valid 4+ week trading range breakouts on stocks meeting our criteria or in
close calls that are in clearly leading industries, in a diversified fashion. This
week, our
Bottom RS/EPS New Lows remained non-existent with readings of 1, 1, 0, 1,
and 0, with one breakdown of a 4+ week range, no valid trades and no close calls. The
short-side breadth remains bleak and it will be important to see if it picks
up here on further corrective activity.
For those not
familiar with our long/short strategies, we suggest you review my book
The Hedge Fund Edge, my course “The
Science of Trading,”
my video seminar, where I discuss many
new techniques, and my latest educational product, the
interactive training module. Basically,
we have rigorous criteria for potential long stocks that we call “up-fuel,”
as well as rigorous criteria for potential short stocks that we call “down-fuel.”
Each day we review the list of new highs on our “Top RS and EPS New High
List” published on TradingMarkets.com for breakouts of four-week or longer
flags, or of valid cup-and-handles of more than four weeks. Buy trades are taken
only on valid breakouts of stocks that also meet our up-fuel criteria. Shorts
are similarly taken only in stocks meeting our down-fuel criteria that have
valid breakdowns of four-plus-week flags or cup and handles on the downside.
In the U.S. market, continue to only buy or short stocks in leading or lagging
industries according to our group and sub-group new high and low lists. We continue
to buy new long signals and sell short new short signals until our portfolio
is 100% long and 100% short (less aggressive investors stop at 50% long and
50% short). In early March of 2000, we took half-profits on nearly all positions
and lightened up considerably as a sea change in the new-economy/old-economy
theme appeared to be upon us. We’ve been effectively defensive ever since, and
did not get to a fully allocated long exposure even during the 2003 rally.
On the long side, we like the
close calls from this week:
(
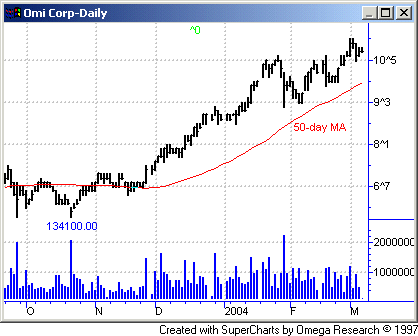
OMM |
Quote |
Chart |
News |
PowerRating) and
(
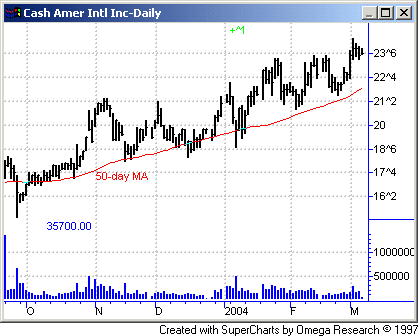
PWN |
Quote |
Chart |
News |
PowerRating); the close calls from last week:
(
AUO |
Quote |
Chart |
News |
PowerRating) and
(
FDG |
Quote |
Chart |
News |
PowerRating); and recent close calls from past
weeks:
(
PPC |
Quote |
Chart |
News |
PowerRating),
(
NFI |
Quote |
Chart |
News |
PowerRating),
(
MBT |
Quote |
Chart |
News |
PowerRating),
(
GALN |
Quote |
Chart |
News |
PowerRating) and
(
NIHD |
Quote |
Chart |
News |
PowerRating). We
would keep allocations low until the trend is more certain and emphasize global
leaders noted above until more trade signals are generated and the trend is
more certain.
Until
next week,
Mark Boucher
