It’s make or break for the Gold ETF
Stocks began the day with an opening gap higher last Friday, but sellers quickly brought the market down to equilibrium within the first thirty minutes of trading. The major indices rolled over to new intraday lows going into mid-day, but recovered to drift slightly higher throughout the afternoon. By day’s end, the S&P 500 had gained 0.2%, the Nasdaq Composite was unchanged, and the Dow Jones Industrial Average lost 0.1%. Both the small-cap Russell 2000 and S&P Midcap 400 indices continued to correct from their steep losses by gaining 0.1% and 0.4% respectively. The Nasdaq finished in the middle of its intraday range, as the S&P closed in the upper third. For the week, each of the major indices added nominal gains to the previous week’s retracement, but the overall technical picture of the broad market did not change much.
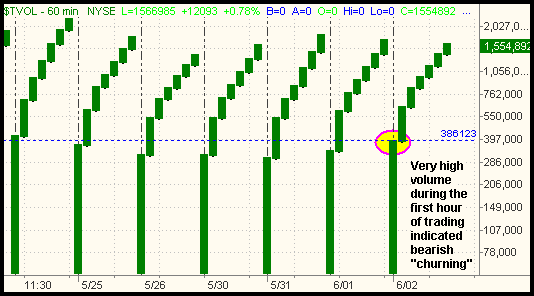
Total volume in the NYSE declined by 8%, while volume in the Nasdaq was 12% lighter than the previous day’s level. On the surface, it seems that the lower volume day of mixed closing prices was uneventful, but a look at the intraday volume patterns reveals some interesting action that occurred in the first hour. Because the broad market gapped up and abruptly sold off, we wanted to see if that selloff occurred on high volume and it certainly did. After the first hour of trading on Friday, volume in the NYSE was coming in 16% higher than the previous day’s first hour, while the Nasdaq was similarly on pace to exceed the previous day’s volume by 18%. It is also important to note that the first hour’s volume in both exchanges was the highest it had been since May 24, the day that the major indices put in their short-term bottoms. Below is a snapshot of the hourly chart we use to monitor and compare intraday volume levels in the NYSE. Each row represents one complete day, while each vertical bar is one hour of trading:

Obviously, volume subsequently dried up throughout the day, which is why turnover finished below the previous day’s levels. Nevertheless, we feel the first hour’s volume surge was significant because the broad market failed to advance at that time. When volume surges higher but prices do not move along with the higher volume, it is known as “churning,” a bearish event caused by stealth institutional selling into strength. It was the opposite of the accumulation that occurred when the market bottomed on May 24.
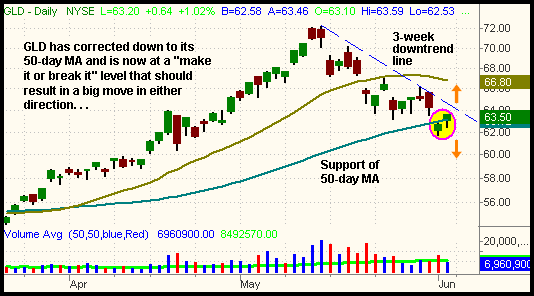
One ETF that is sitting at a “make it or break it” level is the StreetTRACKS
Gold Trust
(
GLD |
Quote |
Chart |
News |
PowerRating). After breaking out to a new historical high on March 29, GLD rocketed 26% in the six weeks that followed. It became quite extended in the middle of May and began a three-week price correction from its parabolic run. On June 1, GLD gapped down to just below its 50-day moving average, but held firm. It crept back above its 50-day MA the following day, which was last Friday. Because the 50-day MA is closely followed by institutions as a pivotal support/resistance level, we feel that GLD is likely to make a big move in either direction over the next one to two weeks. Either the 50-day MA holds as support and enables GLD to resume its long-term uptrend, or it loses support of the 50-MA and drops down to its next major area of support (around $57.50):

As always, we are not in the business of predicting which direction GLD will go from here, but it doesn’t matter to us either way. Rather, we are simply prepared to either buy the break of the three-week downtrend or sell short a break of 50-day MA, whichever way the chart tells us to go. If GLD holds at its 50-day MA, we will be looking to buy on its first solid close above its downtrend line (the red dashed line). Confirmation of the trendline resumption would occur after GLD recovered above its 20-day moving average (which also converges with the prior high of May 30). Conversely, we are just as prepared to sell short GLD if it fails to hold at its 50-MA for more than a day or two. Because GLD could also correct by time and merely chop around in a sideways range, it is important to wait for price confirmation before making a move to either buy or sell it short.
In addition to a possible long entry in GLD, two other ETFs we like on the long
side are the Euro Currency Trust
(
FXE |
Quote |
Chart |
News |
PowerRating) and the iShares 20+ year T-bond
(
TLT |
Quote |
Chart |
News |
PowerRating), both of which triggered for long entry last Friday. In the May 31 issue of The Wagner Daily, we analyzed FXE and mentioned that we expected it to soon break out to a new high. Although it closed a few pennies below its high on Friday, it did indeed gap up and break out above its two-week consolidation, which triggered our long entry in the position. We also bought TLT, which we initially brought to your attention on May 25, because it has now formed a “higher high” and subsequent “higher low” on its daily chart. TLT is in the process of reversing and tested resistance of its 50-day MA for the first time since February 28. It closed a few pennies below the 50-MA, but its current chart pattern indicates a strong chance of trend reversal. Regular subscribers will see our current stop and target prices on both FXE and TLT below, as well as for the DIA position that we remain short.
As for the broad market, the S&P remains at the 50% Fibonacci retracement level of its selloff. It closed just above its 20-day MA, but resistance of both the April low and 50-day MA remain overhead. The bounce in the Nasdaq has been more feeble. As we mentioned last Friday, our overall bias remains on the short side unless the S&P recovers back above its 61.8% retracement, which would also put it back above its 50-day MA. While such an occurrence would not necessarily be the signal to begin aggressively buying the market, it would definitely necessitate a change in the bearish bias. But until that happens, we are viewing the recent bounce in the major indices as an opportunity to initiate new short positions in the stocks and ETFs with the most relative weakness. In addition to the DIA short, we are long two positions (FXE and TLT), but the beauty of those plays is that neither one is directly correlated to the price action of the stock market. Specialty ETFs that track a commodity, currency, or bond market are also great for those of you with cash accounts in which you cannot sell short, especially when in a weak market that provides minimal odds for profitably buying equities-based ETFs and individual stocks.
Open ETF positions:
Long TLT and FXE, short DIA (regular subscribers to The Wagner Daily receive detailed stop and target prices on open positions and detailed setup information on new ETF trade entry prices. Intraday e-mail alerts are also sent as needed.)
Deron Wagner is the head trader of Morpheus Capital Hedge Fund and founder of Morpheus Trading Group (morpheustrading.com), which he launched in 2001. Wagner appears on his best-selling video, Sector Trading Strategies (Marketplace Books, June 2002), and is co-author of both The Long-Term Day Trader (Career Press, April 2000) and The After-Hours Trader (McGraw Hill, August 2000). Past television appearances include CNBC, ABC, and Yahoo! FinanceVision. He is also a frequent guest speaker at various trading and financial conferences around the world. For a free trial to the full version of The Wagner Daily or to learn about Deron’s other services, visit morpheustrading.com or send an e-mail to deron@morpheustrading.com.
