June Pi and Fib Time Ratio Symmetry
From 1990 to 1997, Kevin Haggerty served as Senior Vice President for Equity Trading at Fidelity Capital Markets, Boston, a division of Fidelity Investments. He was responsible for all U.S. institutional Listed, OTC and Option trading in addition to all major Exchange Floor Executions. For a free trial to Kevin’s Daily Trading Report, please click here.
Commentary for 4/10/12
After Bernanke`s 3/26/12 statement that rates would remain near zero through 2014 because of the structural unemployment problem and creeping economic growth the SPX rallied to new cycle highs and finished +1.4% on the day to 1416.51.
However, the market had a head fake last week with what was hyped as a hawkish FOMC statement about no immediate need for a QE 3 etc unless the economy falters [??] The UUP spiked on the 2:00PM bar and the SPX, TLT, and GLD went knife down to extended volatility band levels and then the SPX reversed to only close down -0.4% on 4/3/12.
The US equity market was closed on Good Friday and the BLS jobs report of 120,000 was well below expected, despite including the +90,000 estimated jobs with the birth/death model which always inflates the jobs numbers.
The SPX E-MINI futures sold off -1.1% to 1375 Fri, and then yesterday the SPX had the obvious discount gap opening hitting 1378.24 on the 9:50AM bar versus the -2.0 VB at 1376.51, and daily chart price support at 1378.04 [2/29/12 high] after which it closed at 1382.20 or -1.1% on the day. The TLT spiked to the +3.0 VB on the opening and remained there for the entire session. QE 3 or not, the Fed will keep the liquidity spigot on in this election year.
In the previous commentary I stated that the SPX had two significant declines of -17.3% from the 4/26/10 high, and -21.6% from the 4/29/11 high close and 1370.58 5/2/12 high, and that would make it hard for investors and professional not to take some money off the table anticipating more than a mini pullback after the QTR ends and into the seasonal weak period. The market was obviously extended and O/B on both a monthly and weekly basis, and there was an SPX 123 negative 5 RSI divergence on the daily chart.
The SPX made a 1422.38 high on 4/2/12 and has since declined -3.1% to yesterday`s 1378.24 low after 4 straight down days. The Fed head fake and the jobs report surprise was the accelerator, but it didn`t take much in a market that was so extended with little or no pullback since the 12/19/11 1202.38 low. The SPX was +12.0% for the QTR as volume declined almost 28% on the advance, so Bernanke obviously succeeded in inflating the market as the “herd” assumed a QE 3, and more flooding of liquidity.
The US market is not quite fixed like Zimbabwe, but it is getting close to it with the Fed manipulation. Because it is an election year, and Bernanke is Obama`s hand picked stooge, I don`t expect any immediate seasonal decline of 17-22%, but rather a -5.0% to -10% decline.
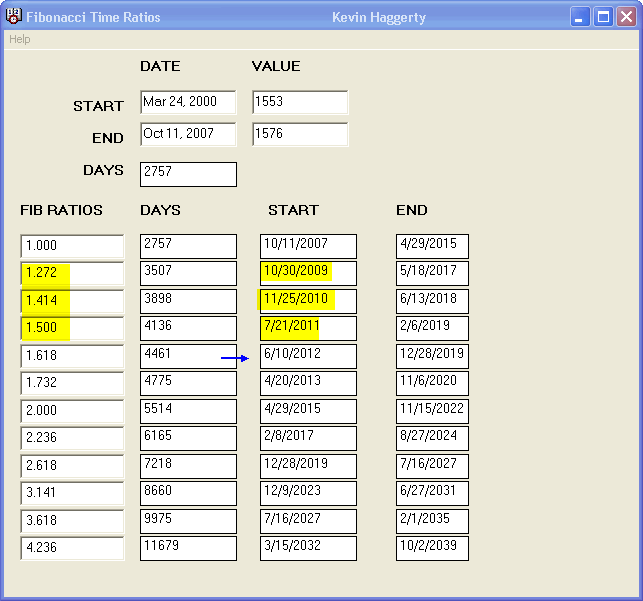
You can`t define the duration or extent of any move, but markets trade geometrically, and if the SPX is declining into the 6/9/12 Pi period, and is O/S, it will be a good buy opportunity. The reverse is also true if the market were to extend its advance into June with just the minimal pullbacks that we have seen so far. The Fib Time ratios of the 3/24/00 and 10/11/07 SPX bull market tops [2757 CD] have also been excellent symmetry at signaling reversals,, as I have marked on the calculator, and the next one is the 1.618 ratio on 6/10/12 [+/- 2 days] You can read the explanation in the 4/9/12 commentary by taking a one week free trial to the trading service.
My manual “Markets Trade with Geometric Symmetry” and the six key calculators I use to measure price and time symmetry are now available at www.geometricmarkets.com

Click here to find full details on Kevin’s courses including Trading with the Generals with over 20 hours of professional market strategies. And for a free trial to Kevin’s daily trading service, click here.
