Keep The Daily Noise In Perspective
What Monday’s Action Tells
You
Friday was a daytrader’s bounce coming off
the 4
MA of the volume ratio of 18 and breadth -1136. NYSE volume was 1.39 billion
on
the bounce, and price was reversed yesterday on 1.53 billion. There is lots
going on on the news front, but there always is, and it’s a question of
whether
the market ignores the news or not.
For Active
Traders
It was a new low retracement close for the
SPX
(
$SPX.X |
Quote |
Chart |
News |
PowerRating) yesterday at 1104.43 and -1.4%, while the Dow
(
$INDU |
Quote |
Chart |
News |
PowerRating)
closed at 10,103, -1.3%. The Nasdaq
(
$COMPQ |
Quote |
Chart |
News |
PowerRating) at 1939 gave back -2.3%
and
the
(
QQQ |
Quote |
Chart |
News |
PowerRating)s -1.7% at 34.90. The Nasdaq is now -9.5% close-to-close
and -10%
high-to-low, while it is just +2.9% above its 40-week EMA. It is in its
ninth
week down from the 2140 closing high and seventh week from the 2154
high.
The Dow, on the other hand, closed at 10,103
and
is just 2.3% above its 40-week EMA of 9874 and is five weeks down from its
high
close of 10,628 and four weeks down from its 10,754 high. Neither the SPX or
Dow
have closed -5.0% from their rally highs. For the SPX, that is 1100 and then
1088 for a -6.0% close-to-close. Net net, the SPX has to decline more to set
up
a really good position trade. This is only the second declining week off of
the
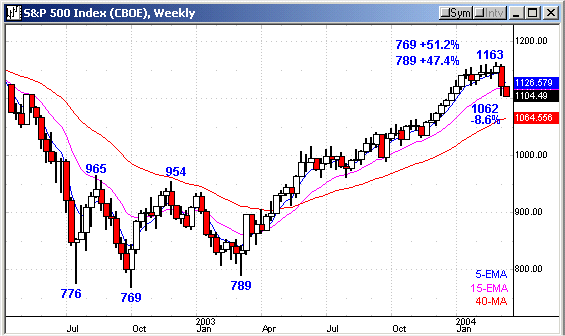
1163 high, and that is not the retracement to set up a sustained move. The
40-week EMA is at about 1062, and that would be a -8.8% decline high-to-low
from
1163.
There has been nothing resembling a
retracement
to the 40-week EMA since this third leg started after the 789 retracement to
the
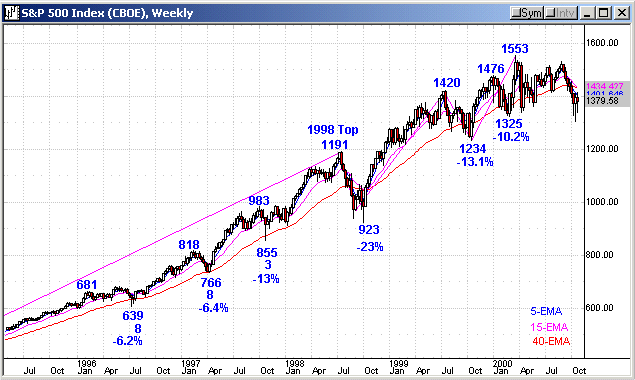
769 October 2002 lows. Before this bull run is over, there will be more than
one. I have included the SPX weekly chart from the 1995 breakout, which
shows
you the three retracements to the 40-week EMA before the -23% 1998 bear
market.
The percentage declines were -6.2%, -6.4% and -13.1% move from high-to-low.
The
decline time in weeks was 8, 8 and then 3 before the 1998 decline. As you
can
see with the 10% ZigZag line, the only 10% retracement close-to-close was
the
1998 bear market. It gets more volatile approaching the 1553 top with
declines
of -13.1% and -10.2% before the last run to the 1553 bubble top.
Looking at the current SPX weekly chart, you get
a better perspective of the inevitable and normal retracements to the 40-week
EMA zone, and it certainly appears that 1163 will be surpassed, and at worst
case tested. Bull markets don’t end with the 5-week EMA above the 15-week EMA,
which is also above the rising 40-week EMA, excluding any catastrophic world
event.
| size=2>Â | Tuesday
3/9 | Wednesday
3/10 | Thursday
3/11 | Friday
3/12 | Monday
3/15 |
| color=#0000ff>Index | Â | Â | Â | Â | Â |
| color=#0000ff>SPX | Â | Â | Â | Â | Â |
| color=#0000ff>High | 1147.32 | 1141.45 | 1125.96 | 1120.63 | 1120.57 |
| color=#0000ff>Low | 1136.84 | 1122.62 | 1105.87 | 1106.78 | 1103.36 |
| color=#0000ff>Close | 1140.57 | 1123.91 | 1106.79 | 1120.60 | 1104.43 |
| color=#0000ff>% | -0.6 | -1.5 | -1.5 | +1.3 | -1.4 |
| color=#0000ff>Range | 10.5 | 18.6 | 20.1 | 13.9 | 17.1 |
| color=#0000ff>% Range | 35 | 7 | 5 | 99 | 6 |
| color=#0000ff>INDU | 10457 | 10297 | 10128 | 10240 | 10103 |
| color=#0000ff>% | -0.7 | -1.5 | -1.6 | +1.1 | -1.3 |
| color=#0000ff>Nasdaq | 1995 | 1964 | 1944 | 1985 | 1939 |
| color=#0000ff>% | -0.7 | -1.6 | -1.0 | +2.1 | -2.3 |
| color=#0000ff>QQQ | 35.65 | 35.17 | 34.88 | 35.52 | 34.90 |
| color=#0000ff>% | -0.3 | -1.4 | -0.8 | +1.9 | -1.7 |
| color=#0000ff>NYSE | Â | Â | Â | Â | Â |
| color=#0000ff>T. VOL | 1.48 | 1.65 | 1.89 | 1.39 | 1.53 |
| color=#0000ff>U. VOL | 261 | 197 | 254 | 1.20 | 168 |
| color=#0000ff>D. VOL | 1.20 | 1.44 | 1.61 | 177 | 1.35 |
| color=#0000ff>VR | 18 | 12 | 14 | 87 | 11 |
| color=#0000ff>4 MA | 42 | 29 | 18 | 33 | 31 |
| color=#0000ff>5 RSI | 32 | 17 | 12 | 35 | 25 |
| color=#0000ff>ADV | 1237 | 845 | 898 | 2442 | 850 |
| color=#0000ff>DEC | 2070 | 2472 | 2420 | 877 | 2440 |
| color=#0000ff>A-D | -833 | -1627 | -1572 | +1565 | -1590 |
| color=#0000ff>4 MA | +154 | -453 | -1136 | -617 | -806 |
| color=#0000ff>SECTORS | Â | Â | Â | Â | Â |
| color=#0000ff>SMH | +0.6 | -2.0 | -0.8 | +2.1 | -2.6 |
| color=#0000ff>BKX | -0.6 | -1.4 | -1.5 | +1.2 | -1.0 |
| color=#0000ff>XBD | -1.6 | -2.2 | -1.6 | +2.0 | -2.4 |
| color=#0000ff>RTH | -0.8 | -2.1 | -0.9 | +0.9 | -1.4 |
| color=#0000ff>CYC | -1.2 | -2.7 | -1.0 | +2.0 | -1.9 |
| color=#0000ff>PPH | -1.3 | -2.2 | -2.2 | +.03 | -1.0 |
| color=#0000ff>OIH | -1.7 | -3.3 | -1.8 | +2.0 | +0.7 |
| color=#0000ff>BBH | -1.1 | -1.8 | -1.3 | +1.5 | -2.5 |
| color=#0000ff>TLT | +0.6 | -.06 | +0.1 | -0.7 | +0.1 |
| color=#0000ff>XAU | +0.1 | -3.2 | +1.2 | -0.4 | -2.3 |
^next^
Â
Today’s
Action
This corner was out most of yesterday and not
involved, but I see that the
(
SMH |
Quote |
Chart |
News |
PowerRating)s closed at 38.57, right at that
confluence outlined in the March 12 commentary, so it is a focus today. The
QQQs
closed at 34.90, with a confluence down through 34, so it is also a primary
focus.
Some of the cyclicals have retraced to rising
40-week EMAs, like
(
CAT |
Quote |
Chart |
News |
PowerRating), so I will scroll for those kinds of stocks and
look for any volume increase early today for a tipoff on the Generals
getting
involved on the retracement.
The
(
OIH |
Quote |
Chart |
News |
PowerRating) and related stocks pulled back
to
the 50-day EMA last Thursday and Friday and were green yesterday at +0.7%,
so
they are also on today’s list.
The brokers have some downside work to do
before
the kinds of setups I like to see.
Keep your weekly chart handy and block out
all of
the subjective market commentary we get from too many inadequate sources and
trade the retracements to the rising longer-term moving averages until it
changes and the lines roll over and start down, at which point, you will do
the
same thing, except on the short side. It’s not rocket science. For
daytraders,
it doesn’t really matter, provided there is volatility.
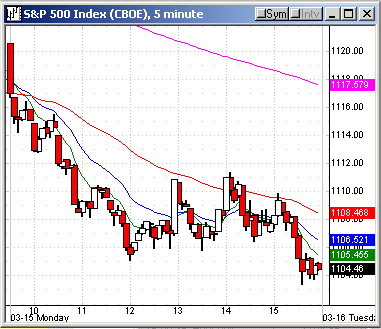
Looking at the early futures at 8:10 a.m. ET,
I
see the green light is on with the S&Ps +6, Dow +49 and Nasdaq +9, so
for
daytraders, the early SPX resistance alert lines are 1111 and 1116 – 1117,
the
240 EMA zone.
Have a good trading day,
Kevin Haggerty


