Key Inter-Market Trading Relationships
From 1990 to 1997, Kevin Haggerty served as Senior Vice President for Equity Trading at Fidelity Capital Markets, Boston, a division of Fidelity Investments. He was responsible for all U.S. institutional Listed, OTC and Option trading in addition to all major Exchange Floor Executions. For a free trial to Kevin’s Daily Trading Report, please click here.
It was a light trading yesterday with NYSE volume at 1.21 bill shs, while the volume ratio was 28 and breadth at -1521. The SPX went out at 868.57 (-1.3), but the ST uptrend off the 741 low remains intact. There was nothing that really stood out in the sectors as most all of the major sector volume was below average, and there was nothing unusual in price action.
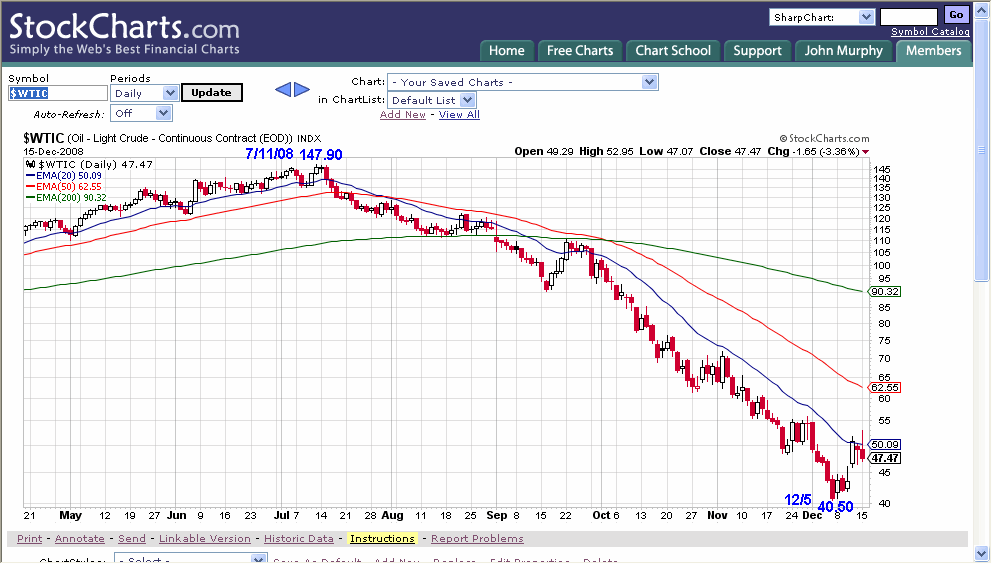
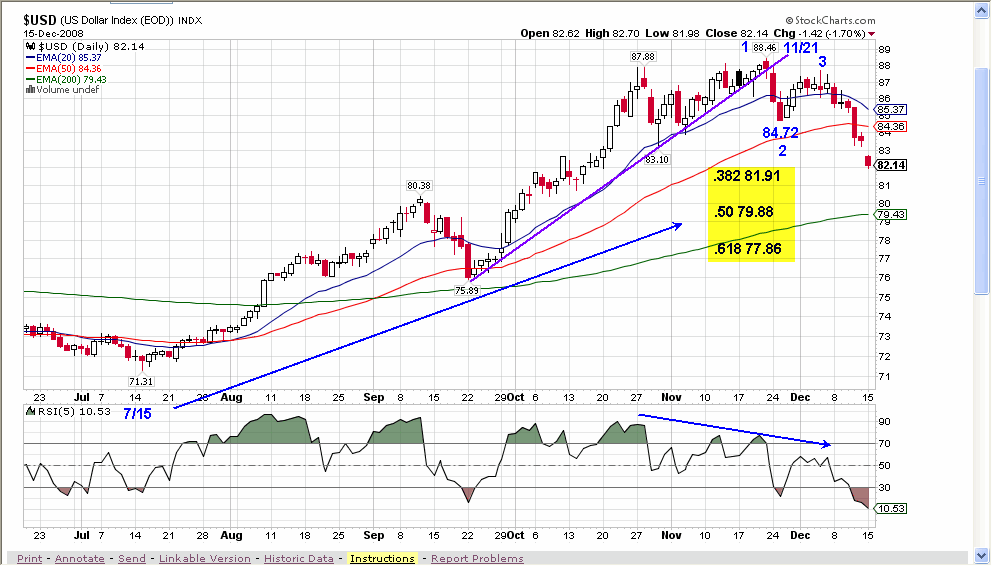
The most significant inter-market relationship right now is the $USD (US dollar index), $WTIC (crude oil), and the S&P 500. The USD made a 71.31 bottom on 7/15/08, while at the same time the WTIC peaked out at 147.90 on 7/11/08, and has since declined to a 40.50 low on 12/5/08. The WTIC 40.50 low had significant time symmetry in that you round off 147.90 to 148, and relate price to time and you see that 12/6 (Sat) is 148 calendar days from that 7/11/08 147.90 top. The WTIC bounced off the 40.50 low and ran to a 52.95 (+30.7%) high yesterday, before declining in the afternoon to the 47.47 close. Also 41.10 was a key angle (315 Deg) measured from the 147.90 high.

The USD peaked at 88.46 on 11/21/08, the same day as the SPX made the 741 low, that preceded the current +24% rally to a 919 high, and the USD has since declined to the 82.14 close yesterday from a 123 Lower Top setup with a negative 5RSI divergence. It is very important for your trading and investing to follow these inter-market relationships on a daily basis.

The volatility over the last 3 months has put most directional traders out of business, or on the sideline, but the day traders are thriving provided you understand how to trade the over reactions that push price to extended levels in either direction. These strategies are utilized in the trading service on a daily basis, and are explained in my different Trading Modules available on the TradingMarkets site at tradingmarkets.com. For example: in the 54 trading days since 9/29/08 there have been 26 days that closed +/- 3.5 %, with 13 finishing plus, and the other 13 minus.

There is an FOMC meeting today and the consensus is the Fed will cut rates, and also the White House (choked) will announce a temporary bailout for Detroit this week. In addition, Friday is the biggest expiration of the year, so there can obviously be some erratic trading, not to mention that there are only 10.5 trading days left in 2008, and there will be many different year end program agendas.
Have a good trading day!
Click here to find full details on Kevin’s courses including Trading with the Generals with over 20 hours of professional market strategies. And for a free trial to Kevin’s daily trading service, click here.
