Key On The 60- And 120-Minute Charts
What Tuesday’s Action Tells You
The game was called off yesterday due to lack of
range on Veteran’s Day. The daily range for the SPX
(
$SPX.X |
Quote |
Chart |
News |
PowerRating) was just
5 points, as it finished at 1046.57, -0.05%, or just -.54 points, virtually
unchanged. NYSE volume was low at 1.16 billion shares, volume ratio 37, while
breadth was negative at -608. The four-day MA of the volume ratio is 45, and
not short-term oversold. (Yesterday’s typo on the volume ratio was corrected
before noon.) If you see something like yesterday where it said the volume ratio
was oversold at 48 and you know that isn’t the case because it starts to become
oversold when the four-day MA is below 40, you should check the commentary again
later, as we usually catch the error early in the morning.
| size=2> | size=2>Wednesday
11/5 |
Thursday
11/6 |
Friday
11/7 |
Monday
11/10 |
Tuesday
11/11 |
| color=#0000ff>Index | |||||
| color=#0000ff>SPX | |||||
| color=#0000ff>High |
1054.54
|
1058.94
|
1062.39
|
1053.65
|
1048.23
|
| color=#0000ff>Low |
1044.88
|
1046.93
|
1052.17
|
1045.58
|
1043.46
|
| color=#0000ff>Close |
1051.81
|
1058.05
|
1053.21
|
1047.10
|
1046.57
|
| color=#0000ff>% |
-0.1
|
+0.6
|
-0.5
|
-0.6
|
-.05
|
| color=#0000ff>Range |
9.7
|
12
|
10.2
|
8.1
|
5
|
| color=#0000ff>% Range |
71
|
93
|
10
|
19
|
62
|
| color=#0000ff>INDU |
9821
|
9857
|
9810
|
9757
|
9738
|
| color=#0000ff>% |
-0.2
|
+0.4
|
-0.5
|
-0.5
|
-0.2
|
| color=#0000ff>NASDAQ |
1959
|
1976
|
1971
|
1942
|
1931
|
| color=#0000ff>% |
+0.7
|
+0.9
|
-0.3
|
-1.5
|
-0.6
|
| color=#0000ff>QQQ |
35.83
|
35.95
|
35.64
|
35.21
|
35.08
|
| color=#0000ff>% |
+0.9
|
+0.3
|
-0.8
|
-1.2
|
-0.3
|
| color=#0000ff>NYSE |
|
|
|
||
| color=#0000ff>T. VOL |
1.36
|
1.42
|
1.41
|
1.22
|
1.16
|
| color=#0000ff>U. VOL |
679
|
908
|
693
|
335
|
426
|
| color=#0000ff>D. VOL |
657
|
494
|
689
|
878
|
710
|
| color=#0000ff>VR |
51
|
65
|
50
|
28
|
37
|
| color=#0000ff>4 MA |
54
|
57
|
51
|
48
|
45
|
| color=#0000ff>5 RSI |
59
|
69
|
56
|
43
|
41
|
| color=#0000ff>ADV |
1637
|
1893
|
1769
|
1146
|
1308
|
| color=#0000ff>DEC |
1590
|
1348
|
1475
|
2111
|
1916
|
| color=#0000ff>A-D |
+47
|
+545
|
+294
|
-965
|
-608
|
| color=#0000ff>4 MA |
+448
|
+491
|
+243
|
-20
|
-184
|
| color=#0000ff>SECTORS |
|
|
|
||
| color=#0000ff>SMH |
+1.8
|
+0.5
|
-0.3
|
-2.4
|
+0.3
|
| color=#0000ff>BKX |
-.02
|
+0.6
|
-0.8
|
-0.3
|
-.09
|
| color=#0000ff>XBD |
-0.7
|
+0.5
|
+0.9
|
-1.3
|
-0.6
|
| color=#0000ff>RTH |
-0.8
|
+1.0
|
-0.9
|
-0.6
|
+0.3
|
| color=#0000ff>CYC |
-0.4
|
+0.7
|
-0.3
|
-1.7
|
-0.2
|
| color=#0000ff>PPH |
+0.2
|
+0.6
|
-0.7
|
-0.7
|
+0.3
|
| color=#0000ff>OIH |
+0.9
|
+0.1
|
+0.4
|
-1.3
|
-.05
|
| color=#0000ff>BBH |
+0.5
|
+1.1
|
-0.8
|
-2.7
|
-0.3
|
| color=#0000ff>TLT |
-0.7
|
-1.0
|
-0.06
|
-.08
|
0
|
| color=#0000ff>XAU |
+.02
|
-1.9
|
+2.6
|
-1.2
|
+0.3
|
For Active Traders
The 10:20 a.m. ET bar was the intraday low of
1043.46 and a marginal trade through of the 20-day EMA of 1045.15 and
1044.80
low. A long trade was taken on the reversal of that low or 20-day EMA, but
it
only rallied to 1048.23 on the 11:05 a.m. bar. From there, it was chop for
the
rest of the day.
It reversed the 20-day EMA and 1044.80 low
again
after 3:15 p.m., but short entry was not taken because the market was just
dead
with price drifting and too late in the day. It traded up a couple of points
in
the last half-hour to close at 1046.57. This corner ended the day early
yesterday after the contra move failure.
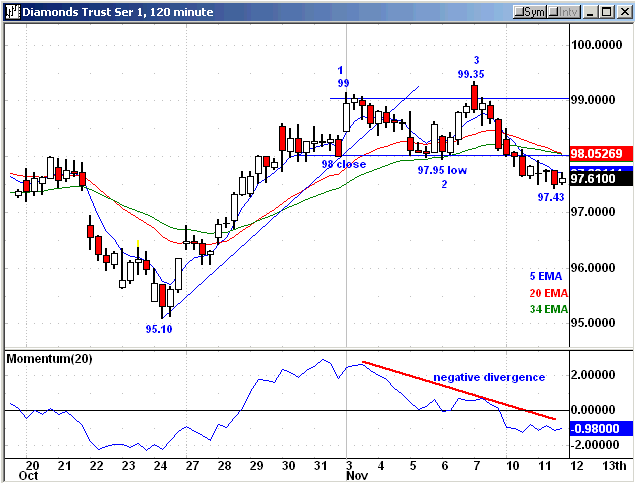
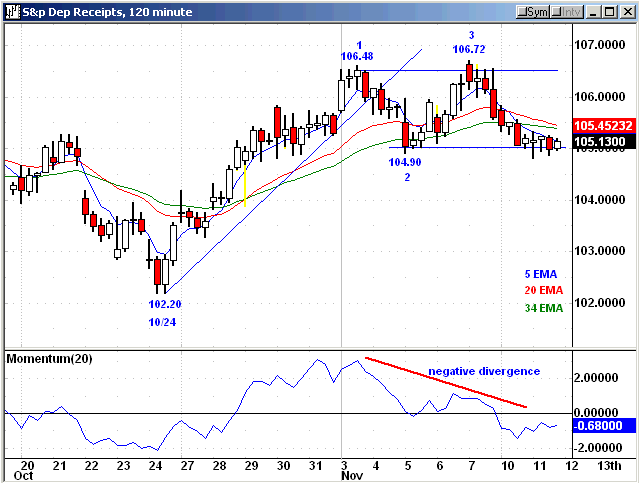
I have included the 120-minute charts of both
the
(
DIA |
Quote |
Chart |
News |
PowerRating) and
(
SPY |
Quote |
Chart |
News |
PowerRating) that show you the defined 1,2,3 higher tops preceded
by
the negative divergence in the 20-period momentum indicator. (I use the
Chande
Momentum Indicator, but TradingMarkets uses Qcharts, and they don’t have it.
If
any of you are Qcharts users, give them a push to include it.) I never take
a
1,2,3 higher top in an uptrend unless there is a negative divergence.
On the SPY chart, 106.48 is the high close
and
104.90 the low, with 105.04 the low close. On the DIA chart, it is the same
for
the 99 high close and the 98 low close. It is a more conservative entry
using
the close, but if that close is too far below the swing point 1 high, then I
would use the midpoint. (Reverse for buys.)
For Today
Today starts out with the DIAs having closed at
97.60, so 98 becomes initial resistance, while the SPY closed at 105.16, just
above its 104.90 pivot low and 105.04 close, with the 20-day EMA at 104.96 and
1045.28 for the SPX. The early futures are small green at 7:45 a.m., with the
Dow +15, Nasdaq +4 and S&P +1.5. After the day off, we will have to see the
action today to get back into the short-term rat race because a -1.8%
down in the SPX is not a retracement that creates a good short-term oversold
condition, and that’s all we have so far from the 106.72 high on the SPY.
Have a good trading day,
Kevin Haggerty


