Key price and time zone this week
Kevin Haggerty is
the former head of trading for Fidelity Capital Markets. His column is
intended for more advanced traders. Kevin has trained thousands of traders
over the past decade. If you would like to be trained by him,
ext. 1.
Last week the SPX finished up 1.7%
same as the previous week. Friday was
essentially a push, closing at 1220.14, +.02%. Daytraders made money on
the short side with a 1,2,3 lower top short entry below 1221.07, which declined
6.6 points to the 240-EMA, which is also where leg AB=CD (1214.09). The rest of
the day went sideways until a two-point jiggle in the last 20 minutes up to the
1220.14 close (see SPX 5-minute chart). Thursday and Friday were both plus days
(0.4% and +.02%) for the SPX but the internals did not confirm. The SPX was
+0.4% on Thursday to 1219.94 but the volume ratio was 58 and breadth just
+95. On Friday, the SPX was +.02% with a volume ratio of 48 and breadth -221, so
that was a negative. NYSE volume dropped to 1.52 billion shares on Friday from
2.0 billion shares on Thursday. It still appears that any potential
negative news out of Washington leads to rising SPX prices, so any air pockets
down have been stabilized and their prices pushed up artificially. That changes
the game a bit for a short-term trader, but not for the better if you play both
long and short.
The interest rate increase is accelerating with the TLT -2.0%
for the week ending 10/28 and -1.3% last week. The spread between the 10-year
Treasury note and 13-week T bills is <1%, so that is a major negative for the
equity market, but with a lag time going forward.
The US dollar made a continuation pattern breakout on Friday
(daily chart) so if that holds and there are rising rates and a rising dollar,
then gold will test the 450 – 440 zone or lower, which could set up a long
opportunity in gold stocks.
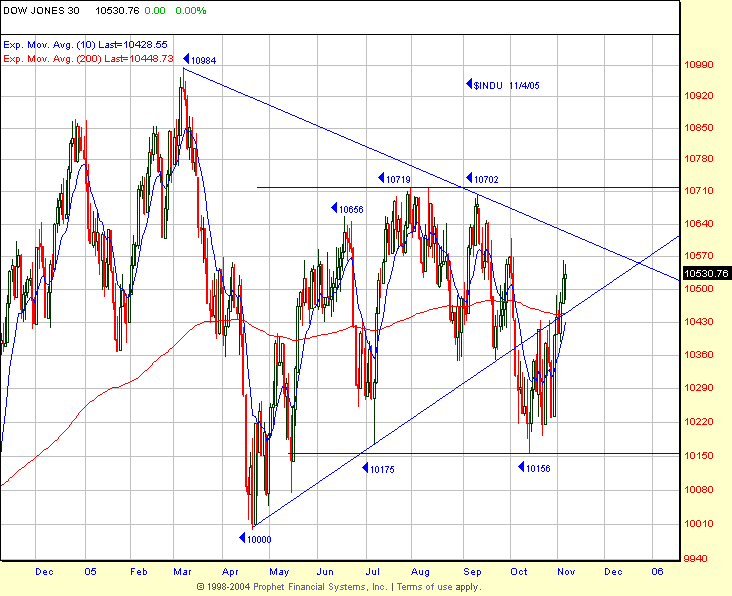
The Dow closed the week at 10,531, above its longer-term
moving averages of 10,436 (233-day EMA), 10,449 (200-day EMA) and 10,498
(200-day SMA), so that is the immediate downside focus zone. On the decline to
the 10/13/05 10,156 low, Dow broke below a triangle which started with the
03/07/05 10,984 top. The upper channel line of that triangle is now about
10,700, which is also point-and-figure resistance if there is any upside
continuation this week. In fact, the Dow has ranged in just a 0.5% spread
between 10,719Â – 10,156 since May 2005. That was OK for those that have
been buying on weakness and selling strength but obviously zero for those just
long the market. This week is a time zone with some symmetry in the major
indices after advancing since 10/13 and the SPX 1168 low, so an air pocket down
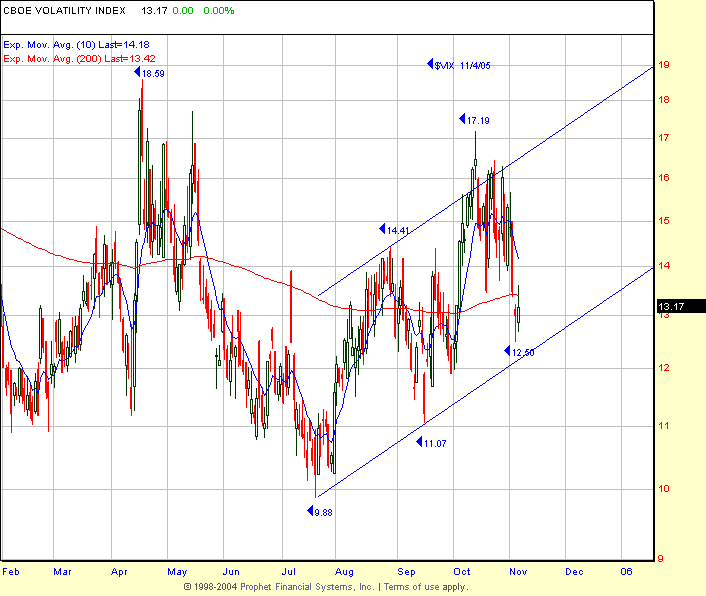
this week has the highest probability. The $VIX hit 12.50 on Thursday, down from
17.19, the 10/13 high. It is down to its lower channel line, closing at
13.17 on Friday. Watch this price action for an early read on a possible air
pocket in the major indices this week (see chart).
The SPX primary trend remains soft as the SPX bullish
percentage figure closed at 58, after the SPX 1225 intraday high versus about
76% at the August 1246 high. This simply means that the SPX is being rallied up
on fewer stocks and many buy programs, which can keep pushing the SPX actual
price higher in spite of the index breadth weakness, but sooner or later that
game will fail. The overall NYSE bullish percentage is a bit weaker at 56 and I
expect it to remain that way into year-end as the Generals attempt to mark up
the SPX stocks in many of the funds, which are now just quasi-index funds. The
SOX is +9.9% in five days to a 454 high, which is right to the low end of the
486 – 453 range from July to 10/10/05. This bounce comes from the .618
retracement zone to the 377, 04/29/05 low. The high probability short-term long
opportunity has passed.Â
The odds for the Generals’ year-end mark up increases as time
passes without any air pocket down.
This is being done Sunday for Monday.
Have a good trading day,
Kevin Haggerty


