KKD: Anatomy Of A Top
Before I get into the crux of this report, I
wanted to let you know that the NASDAQ/NASDAQ 100 underperformance is back to
woeful again. I thought the recent better action in the SEMIS would close the
gap between the two and the NYSE…but that was fleeting. The NASDAQ/NASDAQ
100 charts continue to take on very ominous tones. The weaker of the two is
the NASDAQ 100.
Krispy Kreme. The doughnuts are terrific. The
stock is toast. If you still own the stock, please read this report twice…as
the stock’s action begged you to sell on March 10th, 2004…the same day I
told my listening audience to sell. Let’s look at some very important
characteristics that you need to know about.

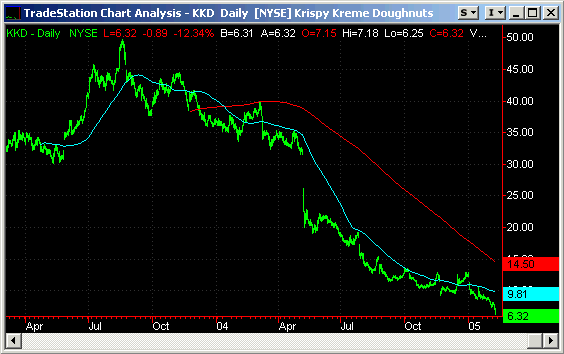
This stock topped out in August of 2003 and was
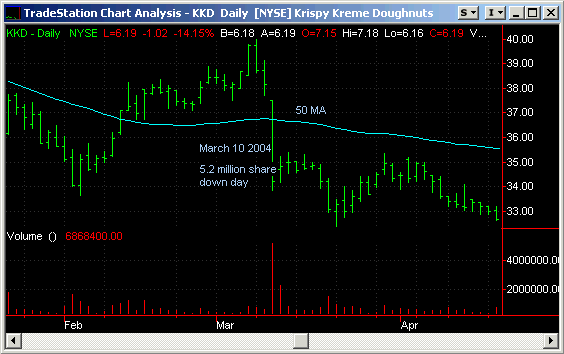
already acting poorly. On March 10th, 2004, it was already trading below its
200-day average while the 50-day average was actually below. This in itself is
a negative. But on that day, the stock dropped over $4, slicing through its 50-day average and breaking all near term support. To make matters worse, the
move was on massive volume of 5.2 million shares. Before that day, the stock
was trading 500,000 shares/day. That is not Aunt Mary and Uncle Bob selling.
That was the big money crowd.

Fast forward to May 7th, 2004. If you still held,
certainly this day should have taken you out. On a whopping 20.5 million
shares, the stock gapped down and lost almost $10 on the day on less than
stellar news. This was a company that said everything was fine. During this
time, I was telling everyone who would listen that it was still a sell…that
the stock was under major distribution, that the company’s business model was
flawed, that the company’s accounting reminded me of Boston Market’s
accounting and that every time I visited the Krispy Kreme store in Orlando, it
was empty.

I know what you are thinking at this point. You
are thinking that the stock is so far down, that there was no way you were
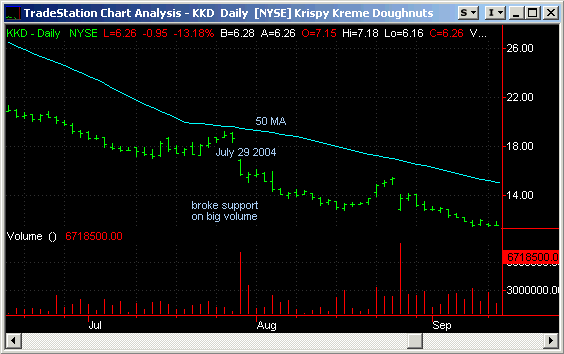
going to sell. In other words, you were in the web. Well, maybe July 29th,
2004 changed your mind as the stock broke another area of support on heavy
volume as the news kept getting worse and worse. Nah. you held on because the
doughnuts were great.

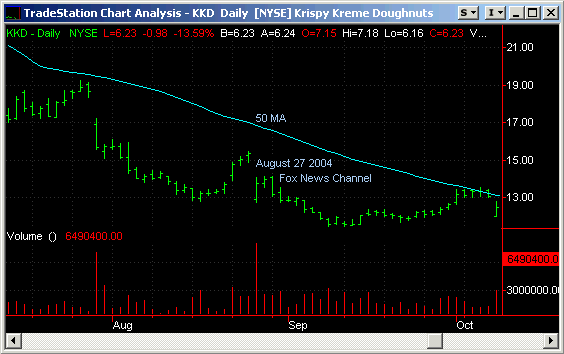
Maybe you sold when on 8/27/2004, at $14, I told a
national audience on the Bulls and Bears show on Fox News Channel that the
stock was headed for another 40% drop as the institutional crowd was going to
continue to sell…and that the company faced bigger and bigger problems. But
you couldn’t sell because you were in the web. You know…you get to the point
where you throw up your arms because you are down so far…and what do you
say? ‘AH…I DON’T CARE IF IT GOES TO ZERO!”

Since, the stock continues to hit new yearly lows
as talk of bankruptcy and accounting investigations pervade the air. I am
writing this not to upset those that may still have the stock. I am writing
this because you need to know the stock’s action gave clue after clue that
there were troubles ahead. ENRON showed the same clues. WORLDCON…I mean
WORLDCOM showed the same clues. They all show the same clues…MASSIVE
SELLOFFS AS THE STOCK CONTINUES TO BREAK SUPPORT.
Never get caught in the web. Never let your
emotions get the best of you. Always let price and volume action be your guide
and always err on the side of caution when you see this type of action.
Gary Kaltbaum
