Last Three Days Of The Month
The
Nasdaq 100
(
NDX |
Quote |
Chart |
News |
PowerRating), thanks to another washout in the chosen ones
which gave you trade-through short entries again, made a marginal new low at
2956 before reversing to close in the top of its range at 3167. Two days in a
row of continuation shorts for multipoint moves takes care of any stopped-out
probes.
The intraday high was 3170
by the 10:10 a.m. bar, then the wash down to 2956 which was 214 points and
-6.8%. The 2 deviation volatility band was 2928. This recent volatility has made
the daily moves to the 1.5 and 2 standard deviations a regular occurrence.
However, it won’t be sustained when the panic subsides. The rally was explosive,
as you should always expect in this kind of volatility as the NDX 100 rallied
7.8% to an intraday high of 3186 before closing at 3167.
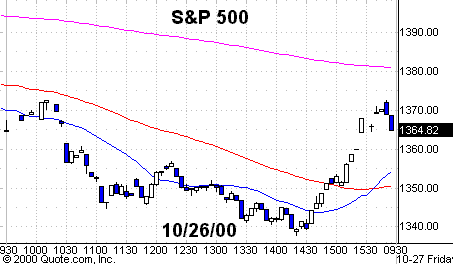
The S&P 500, as I
mentioned Thursday
morning, acted much better in Wednesday’s action and repeated
that yesterday. The prior low was 1305.79 and yesterday it hit an intraday low
of 1337.77 before turning and giving us +2.6% upside. The 1.5 band was 1339.52
and the 2 band was 1331.06. For those of you who attended the New York or Las
Vegas seminars, entry was a 1-2-3 close, trading above 1341.80.
The reversals from the lows
in many of the chosen ones were dazzling with many of them turning 15%-20%.
(
AMCC |
Quote |
Chart |
News |
PowerRating)
for example, turned from a 121 low to 142 or +17.3% in just 13 bars. Don’t
bother analyzing it and getting mesmerized by all the after-the-fact commentary.
Just react to it if you are daytrading.
On Monday, you will have
two new screens that are to be used in conjunction with the S&P 500 and
NDX 100 screens now on the site. The first screen is what I define as “The
3-day Wake-up Call.” This screen identifies stocks in the S&P 500
and NDX 100 that have closed above the previous two days’ highs, have the
largest daily range of the three days, and the most daily volume in three days.
It is sorted by the percentage of the 30-day average daily volume. The column
will say 50, but it is 30, to correspond to the two index screens. We’ll fix
that glitch. This is a good way to identify buying pressure with expansion of
range. Come on in, Generals!
The second new screen is
what I refer to as “Change In Direction.” This one identifies the
stocks in the S&P 500 and NDX 100 that have made at least a five-day low
followed by a change-in-direction day, which means a higher high, higher low,
and a close above the high of the low day. This screen will give you those
stocks where the buyers have shown their hand, and a possible swingpoint low is
in place. This screen is also sorted by the percentage 30-day volume.
Many of you heard me say at
the seminar that one of the hardest things to do is to identify the
opportunities, and that is why TradingMarkets.com will continue to provide you
with the tools to get your homework done efficiently and effectively. It’s not
the amount of practice that does it for you, but the perfect practice that makes
you better.
After a burn-in period, we
will expand the screens to identify sell situations.
face=”arial, helvetica”>(December Futures) | ||
Fair | size=2>Buy | size=2>Sell |
11.20 | 12.40 | 10.00 |
Pattern
Setups
If it’s real, they have to get past
yesterday’s highs to get legs or else you will catch something coming out of the
first consolidations to new intraday highs. Take whichever comes first.
Stocks are:
(
ARBA |
Quote |
Chart |
News |
PowerRating),
(
CIEN |
Quote |
Chart |
News |
PowerRating),
(
JNPR |
Quote |
Chart |
News |
PowerRating),
(
MERQ |
Quote |
Chart |
News |
PowerRating),
(
NEWP |
Quote |
Chart |
News |
PowerRating),
(
QLGC |
Quote |
Chart |
News |
PowerRating),
(
SANM |
Quote |
Chart |
News |
PowerRating),
(
VRTS |
Quote |
Chart |
News |
PowerRating) and
(
ADBE |
Quote |
Chart |
News |
PowerRating). Also take a look at a couple of the semis,
(
TXN |
Quote |
Chart |
News |
PowerRating),
(
MU |
Quote |
Chart |
News |
PowerRating),
(
CREE |
Quote |
Chart |
News |
PowerRating),
and also in the biotech area,
(
MLNM |
Quote |
Chart |
News |
PowerRating). Both
the SPYs and QQQs also set up.
Remember, this is the end of the month
— we’ve got today and two days next week. After looking at some of the
institutional performances in the newspaper after Wednesday’s action, some funds
down anywhere from 6%-8.5% and the funds that were generally beating or even
with the S&P 500 down 3.5%-4% vs. the 2.4% up in the S&P 500, tells me
that they’d like to get a few of these things tucked into the end of the month
so it doesn’t look so bad.
Have a good trading day.


Do you have a follow-up question about something in this column or other questions about trading stocks, futures, options or funds? Let our expert contributors provide answers in the TradingMarkets Question & Answer section! E-mail your question to questions@tradingmarkets.com.
For the latest answers to subscriber questions, check out the Q&A section, linked at the bottom-right section of the TradingMarkets.com home page.
