Learn how to use pivot points here
Pivot
points, floor levels, S/R values. Various labels for the same tools: a
calculated formula for what should be “fair value” in a market to follow. Before
the days of palm pilots, cell phones and the general wireless world, floor
traders and market makers relied on hand-scribbled price points of where buyers
/ sellers should cluster their stops. The information age has arrived, but these
valuable price points still retain their power over market action hence.
Pivot Point
General Guidelines
Of
utmost importance to know, daily pivot point values tend to be touched or traded
thru
roughly 75% of the time. In other words, seven out of every
ten sessions for any liquid market will see the daily pivot point come into play
at some point during live trading. I know this to be true, because myself and
fellow traders have done the math, counted daily touches of emini markets per
month since March 2003. Anyone interested can readily do the same research we
already have.
Isn’t
that amazing! To know that a certain spot on most any chart will be touched more
often than not can be a powerful tool. Unfortunately, unless one knows what to
do with that information it is worthless at best or harmful at worst. Believe
me, more traders LOSE money with this knowledge than actually make money. Some
of the worst trading sessions touch their pivot points several times (sideways
chop) while some of the best trading sessions miss touching the daily pivot at
all (gap & go trend sessions). Knowing the propensity for a daily pivot point to
be tapped more often than not does help when seeking potential entry and
sometimes exit targets.
In general, a market trading
above its pivot point value is acting bullish while a market trading below its
pivot point is bearish. That’s the most general rule for using these price
measures, and holds true more often than not. Fact is, the same trend filter
applies to all charts and trading timeframes: intraday charts or even daily and
weekly charts.
Pivot point values are not
exclusive to day trading at all. I use them in swing trades and even position
trades for long-term stock holds in IRA accounts. Depending on our time horizon
of trading chart, the applicable pivot value works there too.
Using daily charts for swing
trades in any liquid market would mean we want to keep track of the weekly and
the monthly pivot points. That much is easy: once a week we calculate the
previous week’s price values for a weekly pivot point. The beginning of each
month we calculate previous month’s price action for monthly pivot points.
Simple as that!
Calculations
In the case of index futures, “cash-session†pivot and S/R levels would be
calculated from price action taking place from 9:30am-4:15pm ET for pit trading
sessions. All markets seem to perform best using cash session or pit-traded
hours for pivot point values, but anyone who prefers using “all sessions” data
is absolutely free to do so.
Â
Pivot
Calculations:
Derived
From High (H),
Low (L), Close (C) of previous day:
Pivot
point = P = (H + L + C)/3
You have
free, no strings attached access to a public Excel spreadsheet document setup to
calculate pivot points using any numbers = data that is input. The same document
can be downloaded onto your computer for personal use if you wish. That link is
found on our website at:
www.CoiledMarkets.com inside the left navigation bar.
TradeStation chart users are
also welcome to download our custom written ELD workspaces for pivot point
values measuring pit-traded hours. I happen to use TradeStation charting
software myself, so offering these workspaces is no extra effort on my part.
Other chart services are perfectly fine, but we only offer – supply pivot point
software for charts we use.
Usage
Pivot points can be used as an entry trigger and trend bias filter
accordingly. An individual stock trending above its weekly pivot point is
bullish. Overnight news that drops said stock down to its pivot point at the
open may be offering a high-odds long trade entry near that mark. Periodic pull
backs into the pivot point along with extended oscillators, moving average
values, historical trend lines or similar complimentary tools can be very
effective trend following trade setups.
By the same token, a
commodity market that has trended above its monthly pivot for a year that now
breaks down and trades below that mark warns all who listen that a trend change
appears to be at hand. The trend is our friend until the end, and all good
things eventually come to a climax. Significant trend changes can & do first
show themselves when price action swaps bias around its respective pivot point
values.
Â

Â
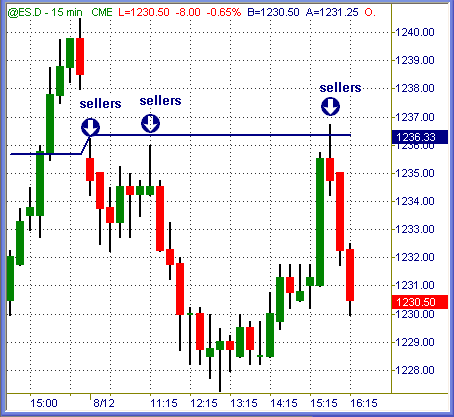
Today the S&P 500 futures
gave a confirmed sell signal (by the methods I use) right at daily pivot
resistance. Short near 1236 soon gave a secondary sell signal on the mark again
before dropping down to session lows below 1228.
Notice what happened on the
late-day short squeeze back to that pivot? Sell orders were parked right there,
waiting to slam buyers in the face. Another valid sell signal which worked for
+6pts into the close. Taking just those two trade signals alone (there were
others) could have offered +14pts or +$700 per each ES contract traded.
Â

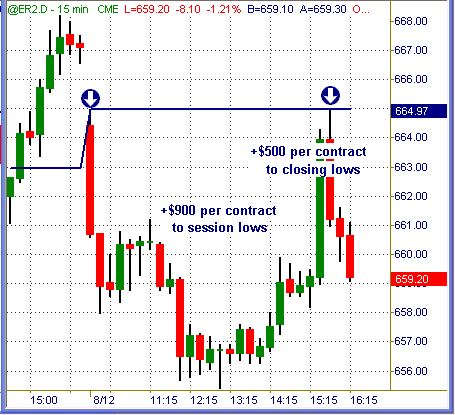
Better than that, the Russell
gave same exact sell signal (all eminis did, today) and promptly dropped +$900
per mini contract to session lows. Late day buying spree got hammered to the
exact tick once today’s pivot point was touched. Sheer coincidence? The sellers
who booked nearly +$600 per ER contract from that key spot on the chart probably
don’t think so.
Two trades, +$1,500 per emini
contract potential. Not bad for knowing some secrets of pivot point trading, if
you ask me ;>)
Â

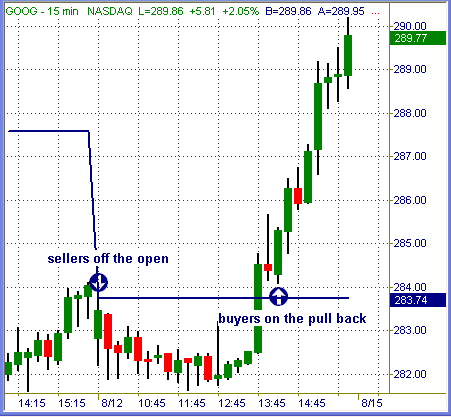
Google-ites we sellers at the
pivot this morning, to the tune of +42 per share. Chump change, on a $300 stock.
Once the buyers got it in gear, a surge candle thru the pivot pulled back to
give a confirmed buy signal near 284.25 area. From there she fired +6 per share
higher in very predictable fashion.
Â

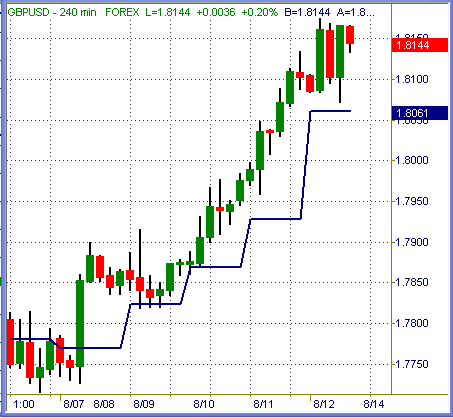
… and in classic trend
action fashion, British Pound walked upwards above its pivot point settings all
week. From Sunday night’s break to Friday’s close, there were nothing but long
trade pull back signals on this chart. Anyone who tried shorting the Cable
either scalped out for meager gains or got scalped while fighting a clear &
obvious trend.
Summation
To be sure, pivot point values play a role in most sessions and markets
collective action. Using them correctly as the tools – filters that they are can
add significant profit dollars to your trading account. Simple, time tested and
certain to work exactly the same tomorrow as they did yesterday.
Please join us for the free,
absolutely no strings attached weekend Market Outlook section posted Sunday
evening by 5:00pm EST inside www.CoiledMarkets.com for weekly chart trend views of ES, NQ, SOX, YM,
TRAN, ER, MD, EURUSD, GBPUSD USDCHF, USDJPY and EURJPY markets. See you then!
Trade To Win
Austin P
Austin Passamonte is a full-time
professional trader who specializes in E-mini stock index futures, equity
options and commodity markets.
Mr. Passamonte’s trading approach uses proprietary chart patterns found on an
intraday basis. Austin trades privately in the Finger Lakes region of New York.
