Let’s Call A Spade A Spade
Today I found something
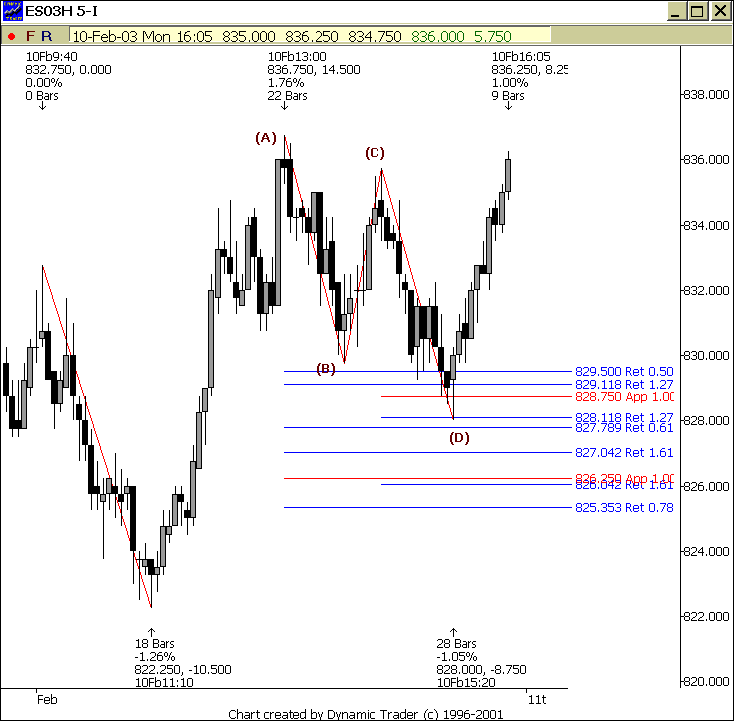
interesting on the 5 minute chart of the E-Mini S&P 500 (ES03H). At
about 3:00 p.m., I looked at this 5-minute chart and had to do a double
take. I could not believe what I was seeing. The chart as of 3:20 p.m. of ES03H
was the identical chart to the current DAILY chart of
(
QQQ |
Quote |
Chart |
News |
PowerRating) and
(
SPY |
Quote |
Chart |
News |
PowerRating).
Check this out. Below is the chart of (ES03H) as of 3:20 p.m.
 
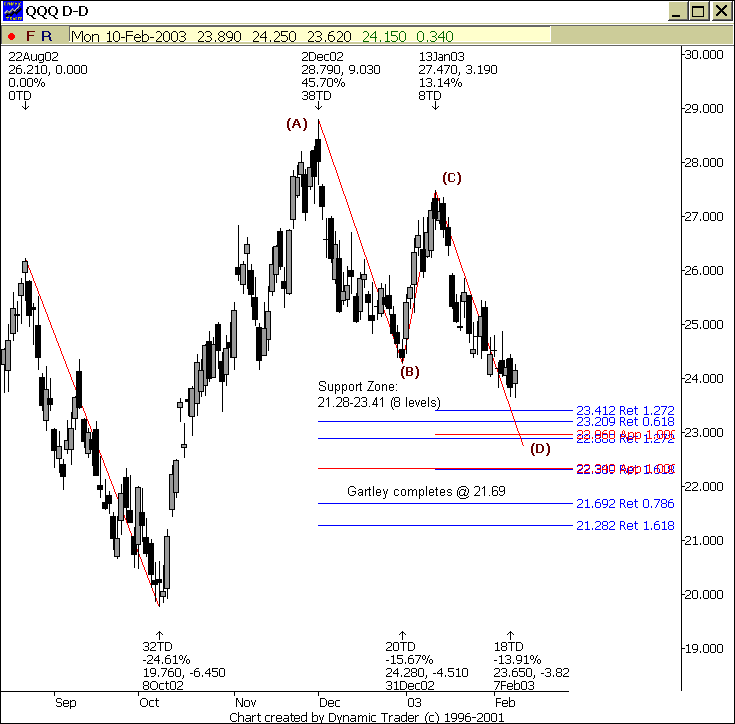
Now, check out the current DAILY
chart of the Nasdaq 100 Tracking Stock
(
QQQ |
Quote |
Chart |
News |
PowerRating):

Now, check out the current daily chart of the S&P 500 SPDRs
(
SPY |
Quote |
Chart |
News |
PowerRating):
 
If you line up the low point of these charts you fill find
the following:
1)Â Â Â Â Â
There was an initial and strong thrust to the upside
2)Â Â Â Â Â
A large amount of time was then spent in a corrective phase
3)Â Â Â Â Â
This corrective phase traded down into a Fibonacci price support zone
4)Â Â Â Â Â
A two step AB = CD pattern was formed into this support zone
Now, check out what the E-Mini did after 3:20pm.

In 9 price bars this contract regained everything that it
had lost over the past 30 price bars! The power of patterns and Fibonacci price
support at work. I see this happen all the time in different time frames.
Interestingly enough the major indices have formed this same pattern on the
DAILY charts. Will it repeat? The market does what the market does, but based on
what I look at on a daily basis these markets are definitely poised to see a
rise of similar proportions to what the e-minis saw today at the end of the day.
I also am currently factoring in that we have time cycles lining up for a
reversal to the upside this week as well. I’ll keep you posted.
Housekeeping: I was
stopped out of my long
(
KKD |
Quote |
Chart |
News |
PowerRating) trade discussed a few columns back. That’s what
I get for trying to go long a sugar stock while I’m on a health kick.
Derrik Hobbs
