Let’s Look At All The Technical Evidence We Watch On A Daily Basis
Since the first day of this year, we told you to expect a much
tougher market where sector and stock selection would be more important than
playing the “market.” We see no reason to change that stance. The “market”
continues to flop and chop around ultimately staying put. Eventually,
something will give and either the market will set up for another move higher
or will break down and head into a bear. Or maybe, it will just sit around
here forever. We suspect “the “market” will give us clues right before it
decides. Right now, it is just so much more important to measure the internals
of the market because certain themes continue to play out…and you need to
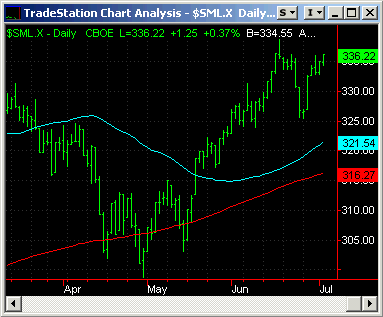
know about them. For starters, secondary small-cap issues continue to lead.Â
Keep in mind, the names that make up this area are less liquid and tougher to
get into and out of. We have not seen anything yet to change this tide as the
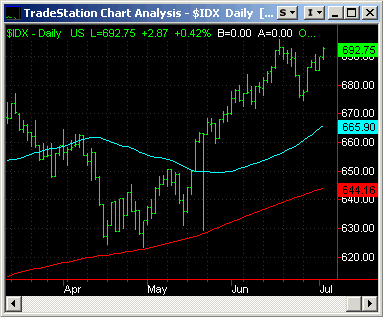
S&P Small-cap 600 is a stone’s throw away from it’s highs. You can also add
the mid-caps to the strong list. The chart of the S&P Midcap 400 speaks for
itself.
Â
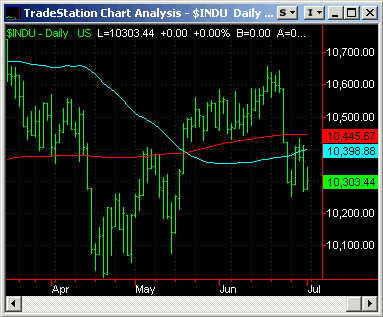
On the other end, the larger cap areas continue to lag. In
fact, the DOW remains very weak and is trading below all major moving
averages. There is a case to say the DOW is tracing out an inverted cup and
handle pattern which would be completed breaking below 10,253. A glance at our
DOW page will show you most charts in the DOW are going no place fast.
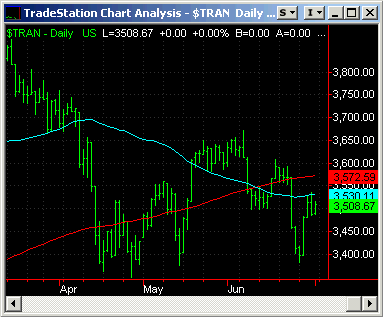
The TRANSPORTS continue to act in a very weak fashion. The good
news is that in the past week, the TRANSPORTS put up a stand near recent lows.
Let us be clear…a break below 3335 will be a long-term negative as the
TRANSPORTS have frequently been an early warning sign for the rest of the
market. This fits in well with what we have been telling you about the
CYCLICAL area. CYCLICAL stocks for the most part, have been under serious
distribution and need to be avoided.
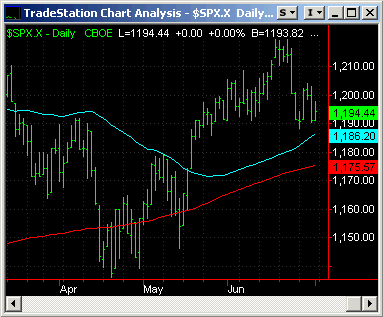
The S&P 500 continues to act far better than the DOW. In fact,
even if the DOW were to break its April lows at 10,000, we are 100% sure the
S&P will not even come close. It is still holding above all major moving
averages…but we must note it is also potentially tracing out an inverted cup
and handle. A break below 1188 would complete the pattern and lead to lower
prices. It would also violate its recent breakout.
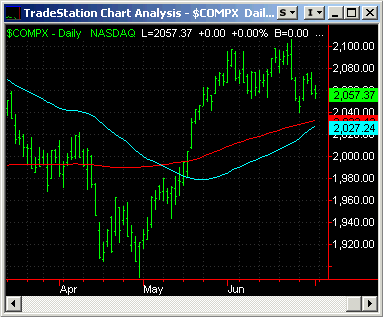
Ever since the 6/23 negative reversal, the NASDAQ has shown
little ability to rally. It is now literally sitting in the middle of the base
that started on 5/17’s breakout at 2000.
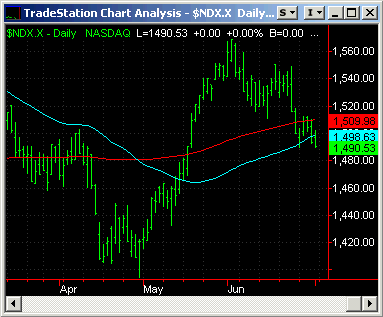
The NASDAQ 100 is another story. It is now much weaker than the
NASDAQ itself. While the NASDAQ has held near-term support, the NASDAQ 100
broke the 1510 area easily and is now trading below all major moving averages.
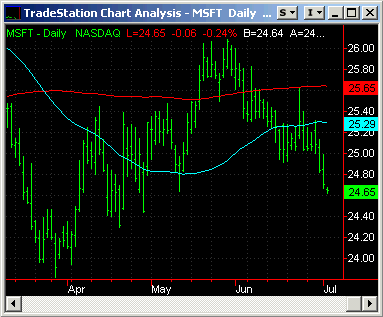
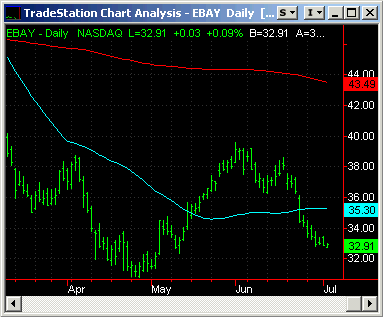
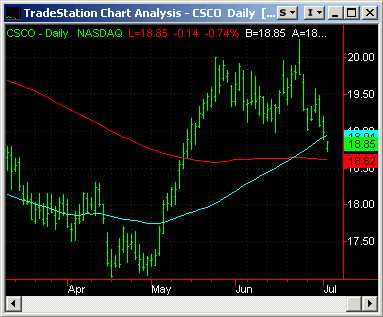
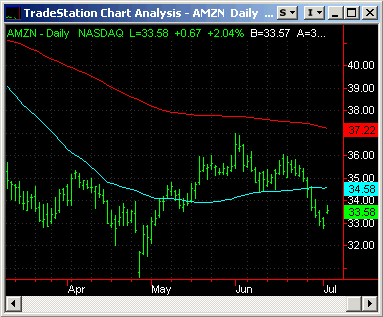
All one has to do is look at charts like MSFT (which is 14% of the NASDAQ 100),
EBAY, AMZN, CSCO and other bigger names to see why the NASDAQ 100 remains in
trouble.
It is not
hard to figure out what has happened recently in the NASDAQ and the NASDAQ
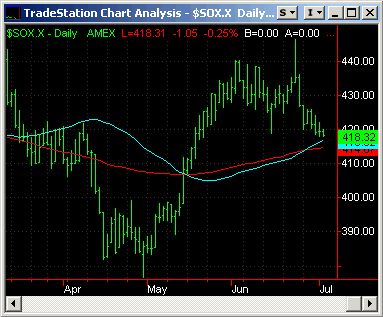
100. Just take a look at the SOX. It also reversed on 6/23. This was one of
the ugliest reversals we have seen as the noise was about as loud as we have
heard in a long time. Certain pundits were shouting at the top of their lungs
to buy TECH…AFTER the recent move up…and the breakout was heralded as the
next move up. What these people forgot is that breakouts only matter on a
closing basis and these types of reversals almost always put
in near-term tops and almost always lead to lower prices in the near-term. The
SOX is now sitting right at support as well as its moving averages. Due to the
SEMICONDUCTOR’s leadership qualities, we suggest the SOX had best put up a
stand here.
As you can see, this is not a market where you can “buy with
both hands.” This continues to be a very tough market to play. We continue to
be amazed by the bull and bear markets in individual areas and individual
names sitting side by side. Just look at the ugly charts of names like IBM,
MMM, DUPONT, US STEEL, AMAZON and LEXMARK and compare it to names like
CORNING, ABERCROMBIE & FITCH, LSI LOGIC, MEN’s WEARHOUSE and GENESCO.  This
is why we have told you all year not to get caught up in all the “market” talk
and instead to pay attention to what’s underneath the hood.
Now let’s look at all the technical evidence we watch on a
daily basis. You will see that there are equally positives as well as
negatives that we are seeing. There are times where we can be enthusiastically
bullish and times where we can be enthusiastically bearish. These are times
where you have to pay much more attention. For starters, it is a plus that the
Dow Jones Utility Average has moved to another new yearly
high.
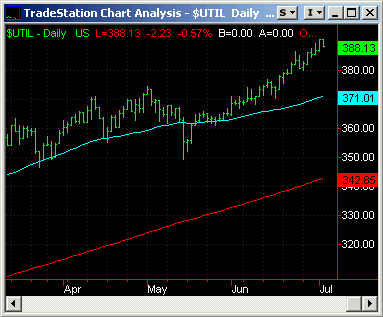
It is also a plus that European markets, especially the
London FTSE has hit new highs. We have noticed throughout the years that this
market usually moves ahead of ours. It is also a positive sign that the NYSE
advance-decline line recently moved to a new ALL TIME HIGH. Normally, this
tops out many months BEFORE the major averages top out but
there have been on occasion, times where the A/D topped out along with the
indices. Finally, it is a positive that on a daily basis, NEW HIGHS continue
to swamp NEW LOWS. Now, let’s get into all the worrisome action we are seeing
underneath the surface. Pay attention! We worry that even though the market
recently came close to last year’s highs, fewer and fewer stocks are in good
technical shape. This tells us that less stocks are keeping the market afloat.
This has always been a warning sign for us and has almost always eventually
marked important tops in the market. Currently, only about 62% of all stocks
are in good technical shape. Way back in January 04, there were over 80% of
all stocks in good technical shape. As we stated earlier, the DOW INDUSTRIALS
as well as the TRANSPORTS continue to lag badly. While small and mid-cap
indices are near all time highs, these important indices are not even close.
This fits in well with our thesis that the next bear market may not be a
humdinger of a bear market as there are still many secondary stocks in good
technical shape. In other words, the DOW may cave, the TRANSPORTS may cave,
the big-caps may cave but the rest may not go along for the ride. We also
worry that if you think about it, all the action we have been seeing for the
past 18 months could qualify as churning. Churning usually marks tops and
sometimes tops take a long time. It is a negative that the FED continues to
raise rates. We are actually thrilled that the market has not done worse with
so many rate hikes. Many are now heralding the prediction that as soon as the
FED stops, the market will skyrocket. We would rather let the market decide on
that.
To say the near term calls are tough to make right now is the
understatement of the year. The market has teased both upside and downside
several times in past months. Instead of predicting, here are the numbers
you need to know about. It’s important that the S&P break out above 1229. We
mention the S&P first because it is the strongest of the major indices. If
it cannot break out, what does it say about the others? The NASDAQ needs to
move above 2107. If both of these major indices can move above these levels
on a CLOSING BASIS, the market gets another leg up.
Conversely, if the S&P breaks below 1188, then we can start talking about
another leg down. We also wanted you to remember that if the DOWÂ breaks
below 10,000, it would be signaling a major top potentially in place…but
the good news is there is no way the S&P will break its April lows with it.
And do not forget the NASDAQ, a break below recent lows and next stop could
be 2000.
SENTIMENT is another
story. We are seeing short-term negatives all over the place. It is a
negative that the percentage of bearish market advisors is down to an
extremely low level of 19.1% while the bulls are now over 55%. It is a
negative that the VIX and VXN remain at multi year lows. These measures
indicate extreme complacency at a time the internals are less than
thrilling. Lastly, you need to be aware that when all these major indices
are NOT in sync, it a a negative. Divergences like we are seeing do not go
on forever. Sooner or later, if they do not resolve themselves to the
positive, they will eventually come back to haunt the market.
Gary Kaltbaum
Â
