Let’s talk about cycles
Gary Kaltbaum is an investment advisor with
over 18 years experience, and a Fox News Channel Business Contributor. Gary
is the author of
>The Investor’s Edge. Mr. Kaltbaum is also the host of the nationally
syndicated radio show “Investor’s Edge” on over 50 radio stations. If you
would like a free trial to Gary’s Daily Market Alerts
click here
or call 888-484-8220 ext. 1.
As we head into the new year, let
me make something very clear: the biggest mistake someone can make
right now is to ignore the action of the past week and just shrug it off to
end of the year action. I just love that when the market goes up, I hear it is
because of real buying but when it goes down, it is just about the end of the
year. In fact, it is a distinct negative that the market could not rally
during what is supposed to be a time of seasonal strength. Not only did the
market not rally, but some areas of the market are now breaking the short-term
areas of support I laid out for you. Markets just don’t go down. They have to
set up to move lower. The bottom line is that for weeks, I have been pointing
out to you the internal deterioration in this market. (THE SET UP) This
deterioration included poor advance/decline figures as well as New High
figures. Markets cannot continue to the upside when on a daily basis, these
figures are going south.
am not the biggest believer in cycles but when everything else is aligning, it
is something that must be watched. Recent history shows that market bottoms
have occurred almost every 4 years. Market bottoms occurred in 1962, ’66, ’70,
’74, ’78, ’82, ’90, ’94, ’98 and 2002. The only missing 4 year low was in
1986. The market rallied late into 1987 before that thrilling October.
Unfortunately, you cannot have a decent bottom in 06 without some pain
first…thus the potential for a less than thrilling first few months of the
year…especially with all the toppy action that has occurred
lately….especially with the extreme bullishness and total lack of
complacency we have been seeing…and especially with a yield curve that has
inverted. But don’t worry about the inverted yield curve as every economist is
out saying the famous words:" THIS TIME IS DIFFERENT!" They are saying this
even though the very last time the yield curve inverted was September of
2000…which again forecasted problems ahead. But don’t worry! The last point
I want to make in this paragraph is about something I have been hearing the
past few weeks. I have been hearing to not worry about the market because all
the news is good. The economy is in good shape. Interest rates remain low. OIL
prices have come down. Jobs are being created. Only one problem with all
this and that is: MARKETS TOP WHEN THE NEWS IS GOOD AND EVERYONE KNOWS IT. I
am always amazed that more people have not spent time looking into this.
facts…I am still worried. I suspect the market is due for some short-term
bouncing but all the subsurface deterioration I have been warning you about is
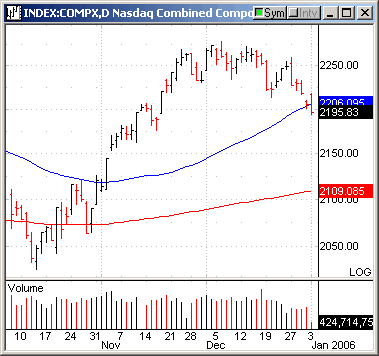
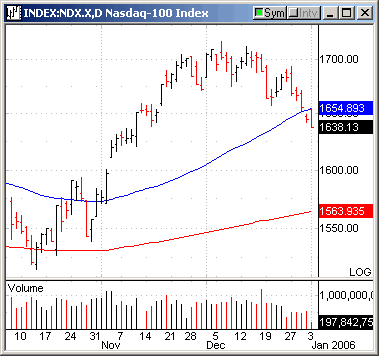
now starting to tug at the major averages. As I have told you, the NASDAQ
(
COMP |
Quote |
Chart |
News |
PowerRating),
NDX and the SOX
(
SOX |
Quote |
Chart |
News |
PowerRating) have been lagging. You should know that these areas
almost always lead the market up and lead the market down. That’s why I have
pointed it out so often. I told you the NASDAQ had a date with its 50 day
average…and that’s where it sits right now…which is 2205.


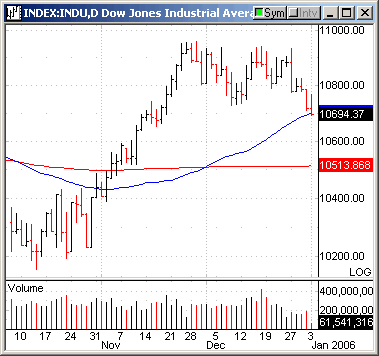
still holding the 50 day average by the hair of its chinny chin chin.

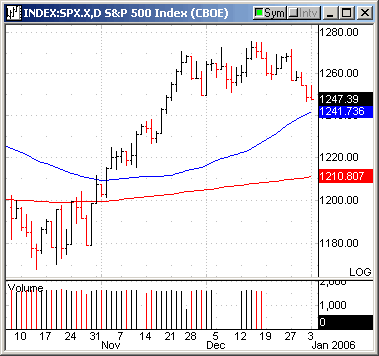
you…but is still above the the 50 day at 1240.

show that all are rolling over near-term. If all these moving averages do go
by the wayside, odds favor the recent advance is DEFINITELY over and more
corrective work is in the cards before the market even has a chance to move
meaningfully higher.
depressing report. There is still plenty of good going on…and who knows?
Maybe everyone comes back from vacation and romps the market to new highs!
(even though the odds do not favor this at this time.) After all, I am still
finding about 6 out of every 10 stocks in good technical shape. First off, the
TRANSPORTS continue to lead in spite of other areas of deterioration.
AIRLINES, TRUCKERS, and RAILS remain in fine shape but do need to pull back as
they are very extended here. Other areas that are still in good shape but
probably need a pullback are BIOTECH (though I am seeing deterioration in this
important group), BROKERAGE, GAMING, GOLD, OIL & GAS (but no longer can you
throw a dart), METALS, STEEL, TOBACCO. Also, WORLD MARKETS continue to totally
outperform our markets. Areas like JAPAN and LATIN AMERICA have been on
steroids. I have yet to see any type of distribution that would slow these
areas down. They are very extended though and due for a pullback.
indexers. I suspect we are going to see more of the same as sector and stock
selection will remain the key in 06. As I started outlining in the year 2000,
I continue to believe we are in a period akin to the 1966-82 period when the
major averages did squat. These periods occur to work off the major excesses
of the prior big bull market.
Gary Kaltbaum
