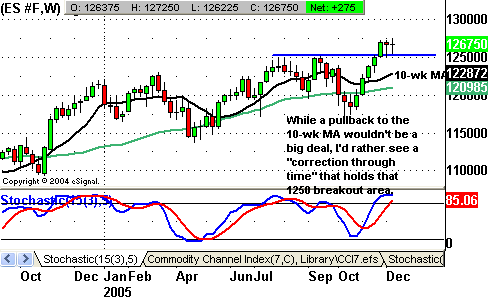
Long bias, but watch this wild card
The major indexes posted a pullback last week,
as upside momentum from previous weeks faded. While the declines were minimal,
it was noteworthy that equities were unable to move higher in a generally upbeat
news backdrop. From what I saw, though, the weakness appeared to be little more
than healthy consolidation from the recent rally. Energy shares displayed
relative strength, thanks to a rally in crude oil (due to speculation of a
colder-than-expected winter). Meanwhile Chip names lagged, after the group
failed to expand on its gains from the previous week’s breakout. This shouldn’t
have been too big of a surprise, given that price often comes back and retests
its prior breakout level. The talking heads did display a great deal of
disappointment over the action in the Chips, but overall, the action seen in the
last 5 sessions appeared constructive.
With the
major indexes finally taking the time to consolidate, the stage could be set for
another move higher into year-end. Two weeks ago, investor sentiment became a
bit too frothy, as everyone seemed to be on the “year-end rally bandwagon”.Â
This was seen in many sentiment measures from various surveys, as well as the
always important Put-to-Call ratio. Put buying recently subsided from its
extreme readings in October. However, in recent days, the put buyers have come
back into the market. This is exactly what’s needed to rebuild a wall of worry
and give the key indexes a shot at recording fresh new highs for the year.Â
However,
while the current consolidation may need more time, I feel it’s still best to
keep a long bias. There are powerful seasonal trends in play, while short-term
downside catalysts seem limited. So, I would expect any correction to be
limited in depth. The wild card in this scenario, though, is more fun and games
from Greenspan and Co. on Tuesday.
                   
Â
Daily Pivot Points for 12-12-05
Â
| Symbol | High | Low | Close | Pivot | Â Â Â Â Â R1 | R2 | R3 | S1 | S2 | S3 |
| INDU | 10805.95 | 10729.91 | 10778.58 | 10771.48 | 10813.05 | 10847.52 | 10889.09 | 10737.01 | 10695.44 | 10660.97 |
| SPX | 1263.08 | 1254.24 | 1259.37 | 1258.90 | 1263.55 | 1267.74 | 1272.39 | 1254.71 | 1250.06 | 1245.87 |
| ES H6 | 1272.50 | 1262.25 | 1267.50 | 1267.42 | 1272.58 | 1277.67 | 1282.83 | 1262.33 | 1257.17 | 1252.08 |
| SP H6 | 1272.50 | 1262.80 | 1267.40 | 1267.57 | 1272.33 | 1277.27 | 1282.03 | 1262.63 | 1257.87 | 1252.93 |
| YM H6 | 10867.00 | 10788.00 | 10833.00 | 10829.33 | 10870.67 | 10908.33 | 10949.67 | 10791.67 | 10750.33 | 10712.67 |
| BKX | 104.73 | 103.18 | 104.12 | 104.01 | 104.84 | 105.56 | 106.39 | 103.29 | 102.46 | 101.74 |
| SOX | 497.79 | 486.85 | 497.21 | 493.95 | 501.05 | 504.89 | 511.99 | 490.11 | 483.01 | 479.17 |
Â
Â
Please feel free to email me with any questions
you might have, and have a great trading week!
Chris Curran
Â
Â
Â
Â
