Look At These Levels For A Decent Contra Move
The
opening was the high of the day for the
(
SPY |
Quote |
Chart |
News |
PowerRating)s and
(
DIA |
Quote |
Chart |
News |
PowerRating)s,
then there was a Trap Door entry that
didn’t carry much, and from the 11:35 a.m. ET bar, it was trend down into the
close with some feeble rally attempts that couldn’t get above the 20-period EMA
on the five-minute chart, touching it four times, followed by lower lows. If you
sold the SPYs and DIAs on retracements to the 20-period EMA, you had a good day.
The “820” trend indicator for the SPX
(
$SPX.X |
Quote |
Chart |
News |
PowerRating) and Dow
(
$INDU |
Quote |
Chart |
News |
PowerRating) is
negative for all intraday time periods, the five-, 15- and 60-minute, with the
8-period EMA below the 20 and declining on all of them.
The daily trend still
remains plus for the Dow, which closed at 8595 vs. the 8-day EMA at 8590 and the
20 at 8553. The SPX closed at 909.93 with the 8 EMA at 907.77 and the 20 EMA at
903.08. The 89-day EMA is at 904.05, and the 50-day EMA is at 899.71. I am
always looking at the “820” sequence, and it helps me determine the stronger
setups. On Friday, I will include the 60-minute SPY chart, and you will see
three very defined patterns since the 87.11 SPY low that you have seen in my
modules. They are two Slim Jim longs and 1,2,3 lower top short.
It was an across the
board red day yesterday, with NYSE volume at 1.4 billion, volume ratio of 26,
and breadth -858. The SPX declined 1.4%, the Dow -1.4%, and the NDX
(
$NDX.X |
Quote |
Chart |
News |
PowerRating) -2.7%. In the sectors, the
(
SMH |
Quote |
Chart |
News |
PowerRating)s led the downside at -3.5%.
After the three straight
up days, then a narrow-range pause day, yesterday’s decline puts the SPYs and
DIAs just above their 20-day EMAs. The DIAs closed at 86.17 vs. the 20-day EMA
at 85.70, the 50-day EMA at 85.36 and the 89-day 85.55. That kind of confluence
makes for a good pivot either way for the daytrader. The SPYs closed at 91.39
vs. the 89-day at 90.72 and the 20-day at 90.66. After a 7.0% gain low to high
in four days for the DIAs, there should be no surprise at a 50% retracement of
the rally off the Dec. 31 low. This is 85.35 for the DIAs. An SPY retracement
also coincides with its EMAs mentioned above. It should also be no surprise that
we got a reaction after the SPY and DIA got up to the .618 – .786 retracement
zone to the Dec. 2 high.
If they open down today
and then trade down to the levels mentioned above, it should provide a decent
contra move. Some volatility range stocks on my watch list are
(
SLM |
Quote |
Chart |
News |
PowerRating),
(
FNM |
Quote |
Chart |
News |
PowerRating),
(
MYG |
Quote |
Chart |
News |
PowerRating),
(
EMMS |
Quote |
Chart |
News |
PowerRating),
(
CSX |
Quote |
Chart |
News |
PowerRating) and
(
UPS |
Quote |
Chart |
News |
PowerRating). Also,
(
AVP |
Quote |
Chart |
News |
PowerRating) now looks like it might be coming out
of the bottom of a symmetrical triangle.
On the short side, a
couple of extended stock setups to watch are
(
ECL |
Quote |
Chart |
News |
PowerRating) and
(
LXK |
Quote |
Chart |
News |
PowerRating),
Have a good trading day.

Five-minute chart of
Wednesday’s SPX with 8-, 20-,
60- and 260-period
EMAs

Five-minute chart of
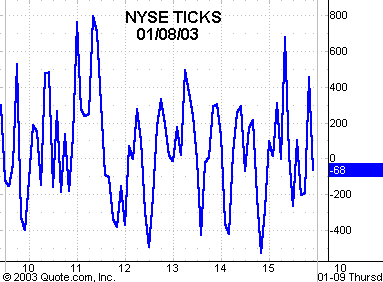
Wednesday’s NYSE TICKS
