Look For Possible Trades On Pullbacks At These Levels
You
were all ready for the Trap Doors and volatility bands yesterday
based on the early red precipitated by
the North Korean missile test and Iraq’s noise about not destroying their
missiles. The fires were stoked by the media and enabled the futures to be gamed
down on zero liquidity. Using the
(
SPY |
Quote |
Chart |
News |
PowerRating) as a Trap Door example because many
of you trade both the ES and SPY, you had the intraday low on the eighth bar,
then the signal bar at 10:10 a.m. ET which set up your inside bar pattern. Entry
was above 82.41 and it carried .78, or +1.0%, to 83.19 before reversing.
This Trap Door was also
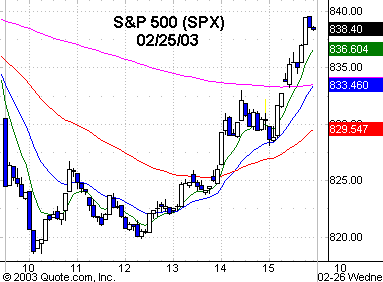
from the 1.0 volatility band on the SPX, which was 819.57. This Trap Door rally
carried to the intraday high (to that point) made on the 9:35 a.m. bar. If you
have the Opening Hour module, you took the trade. 83.20 was also the .50
retracement to the 84.18 Thursday swing point high made on the 3:05 p.m. bar.
Remember, it’s not just the immediate day that you frame.
After that, there was the
first 1,2,3 higher bottom setup that you could have taken if you felt the
dynamics were right. The signal bar wasn’t defined and volume was nonexistent on
either the 11:25 a.m. or 11:30 a.m. bars. That trade ran to 82.84 from entry
above 82.67, or else above the 11:25 a.m. doji bar high of 82.64. If you took
it, you either scratched or had a small loss depending on your stop. I might as
well answer that entry question now rather than by e-mail later.
The second 1,2,3 higher
bottom that set up had more symmetry. The .786 retracement to the earlier 82.22
low was 82.42, and the signal bar low was 82.38. The 12:20 p.m. signal bar had a
close above the open and midpoint and above the previous close on the most
volume for a five-minute bar since the 10:50 a.m. bar, so that gets your
attention. The time symmetry was excellent as the previous bar was the low close
of this setup and also the 34th bar of the day. The intraday low at 82.22 was
the eighth bar. The sequence was pi, with 3.141 rounded off, times 8, and that
gets you to the 34 bar zone, so you had both price and time symmetry. I will
cover sequence trading in-depth in a future Internet-based live seminar that I
am working on now with TradingMarkets. The point is that it doesn’t matter what
time frame you trade because price and time remain the same. The move from this
1,2,3 higher bottom was a very unsuspected moonshot, as the SPY ran +2.4% to an
intraday high of 84.49 from the 82.52 entry level, so depending on how you
managed that trade, you got a good piece of the move.
The
(
QQQ |
Quote |
Chart |
News |
PowerRating)s were easy,
as they gave you an excellent Slim Jim pattern that ran .65, or +2.8%, to a
24.95 intraday high. The reversal from the Trap Door lows enabled the major
indices to even finish in green territory. The SPX
(
$SPX.X |
Quote |
Chart |
News |
PowerRating) and Dow
(
$INDU |
Quote |
Chart |
News |
PowerRating) were both +0.7%, with the Nasdaq
(
$COMPQ |
Quote |
Chart |
News |
PowerRating) and NDX
(
$NDX.X |
Quote |
Chart |
News |
PowerRating) both +0.5%. The mid cap and small cap indices were also positive
at +0.8%. NYSE volume expanded to 1.46 billion, with a volume ratio of 61, and
breadth +512, so it was a nice reversal from the Trap Door and volatility band
level.
Most all of the sectors
also turned green, while the oil services and gold ended red. No surprise there.
The SOX ended at -0.7% FYI: The EWQ which is the France Ishares was down 3.8%.
What a shame. It is now -16% since Jan. 6.
Overall, it was nice to
get a hammer doji with a close in the top of the range, but you don’t get a
change in direction, which would establish yesterday’s low as a swing point low,
unless you get a trade through and close above the high of the low day with a
higher low and high. An early down today might set up some trades on pullbacks
to the 60-minute 20 EMA for the QQQs, SPYs and SMHs.
Have a good trading day,
and keep your helmets on.

Five-minute chart of
Tuesday’s SPX with 8-, 20-,
60- and 260-period
EMAs

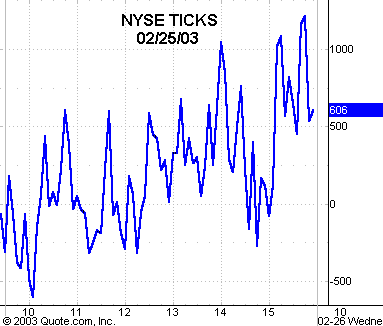
Five-minute chart of
Tuesday’s NYSE TICKS
