Look for shorts while price is in this channel
Charles Sachs has utilized S&P 100 for the past 14 years, both as a trader and an advisor. He uses 24 proprietary indicators in order to structure options strategies which can generate gains whether the market moves up, down or sideways.
Financial markets traded lower Thursday with the
(
XEO |
Quote |
Chart |
News |
PowerRating) (S&P 100) index trading down 1.98 points to the 573.87 level.
The short-term market trend is down, and oversold, and the intermediate-term market trend is up.
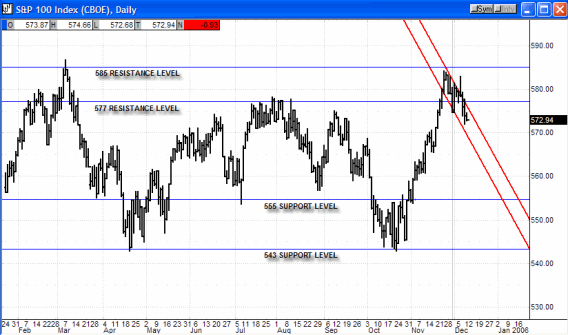
In the chart below, we see a daily bar chart of the S&P 100 index. Each bar (or line) represents the daily trading range for the index. There is also a little horizontal line to the left of the bar which represents the opening price of the day for the S&P 100 index, and a little horizontal line to the right of the bar which represents the closing price of the day for the S&P 100 index.
We also see in the chart below, to the far right, two red lines, which are called channel lines and are parallel and declining. These lines tell us that financial markets are in a downtrend (since they are declining) and that prices should find support (buying interest) at the bottom channel line, and resistance (selling interest) at the top channel line.
Looking at yesterday’s trading, we see that the bar second furthest to the right (of the S&P 100 index) closed in the middle of the channel line so there is more potential for downside action. If the index closes above the top red channel line today, then this resistance line would be breached and set in motion a more sustained advance phase. Conversely, if the top channel line is not breached on any advance phase, then we would expect the S&P 100 index to decline back to the lower channel line.

Bottom Line:
Financial markets remain in a decline phase, as evidenced by the downward channel in the chart above. In the short-term, financial markets are technically oversold so a rise in stock prices would be anticipated.
On any advance of the S&P 100 index from current levels, there is the potential for selling pressure at the 577 level and also at the 585 level, as these are long-term resistance levels, as seen in the chart above.
Based on the current decline phase, the recommended action for investors is either to hold their funds in cash, or for the more aggressive trader to institute short positions between the 577 and 585 levels on the S&P 100 index.
Sincerely, Charles Sachs Chief Options Strategist
