Looking for a leading indicator? Try this…
In the book I’m currently writing on trader performance, I distinguish three
facets of trading:
- Strategy – Your fundamental sources of edge in the markets;
- Tactics – Specific maneuvers in the markets that allow you to implement
your strategy (exploit your edge); - Mechanics – Specific skills that execute your tactics.
An example of strategy would be the historical analyses I
post each day to
determine patterns of market behavior. If yesterday’s market is displaying
one or more historical patterns associated with a significant directional price
tendency, that will become an idea that I trade the next day. In this
article, I will provide an example of tactics: looking at specific lead-lag
relationships between market sectors and the broad market index that you are
trading. Mechanics refer to the proper execution of tactics; for example,
working orders at good prices to take advantage of a lead-lag relationship.
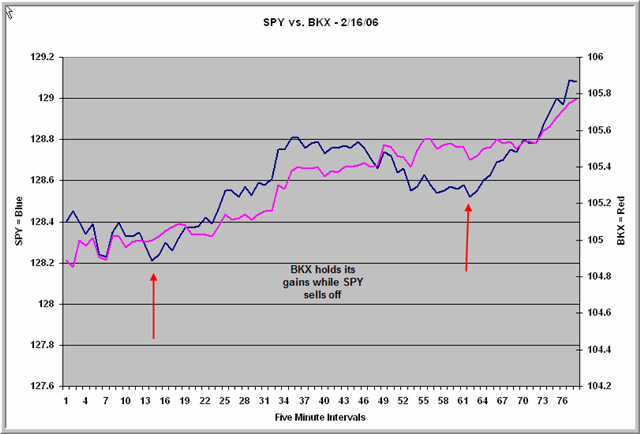
The tactic that you can bank on is illustrated in the chart below. My
historical analyses, as posted on my site, have had me leaning to the long side
of this market. Tactically I know that certain market sectors and markets
tend to lead the S&P 500 Index; one of these is the banking sector (BKX).
My tactic, therefore, was to look for buying opportunities in Thursday’s market
in which the banks were displaying relative strength during S&P dips.
The chart illustrates two of those points during the day.

Banks, of course, benefit from favorable economic activity,
including business growth and housing strength. They also perform well
during a favorable interest rate environment. It stands to reason that
banking stock strength should be a harbinger of good things to come in the
market. Indeed, as I recently posted on my site, when SPY has been up by
more than 2% over a three-day period and BKX has also been up by more than 2% in
that time, expectations over the next week are bullish. When SPY has been
up by more than 2% over three days and BKX has not followed suit, the next
week’s expectations have been bearish. That, by the way, bodes well for
the bulls over the next few days, as BKX has been outperforming SPY–and both
have been up more than 2%.
Knowing these lead-lag relationships can help you time market
entries and ride solid trade ideas. As any military leader knows, the best
of strategies can be undone if tactics are not sound. While it’s helpful
to have a good market feel, it’s also useful to have tested indicators you can
bank on.
Brett N. Steenbarger, Ph.D. is Associate Clinical
Professor of Psychiatry and Behavioral Sciences at SUNY Upstate Medical
University in Syracuse, NY and author of The
Psychology of Trading (Wiley, 2003). As Director of Trader Development
for Kingstree Trading, LLC in Chicago, he has mentored numerous professional
traders and coordinated a training program for traders. An active trader of the
stock indexes, Brett utilizes statistically-based pattern recognition for
intraday trading. Brett does not offer commercial services to traders, but
maintains an archive of articles and a trading blog at www.brettsteenbarger.com
and a blog of historical market patterns at www.traderfeed.blogspot.com.
He is currently writing a book on the topics of trader development and the
enhancement of trader performance.
